Apr 17, 2026
The Grid Bottleneck: AI Devoured All the Compute — But Who's Powering It?
Every 1GW data center needs $1-2B in grid upgrades. Transformer lead times 3+ years, transmission permitting 10-15 years. AI + EVs + reshoring hitting a 1970s-era grid simultaneously. Full teardown of 10 grid infrastructure stocks: ETN quality king, PWR backlog visibility, CEG scarcest asset.
The Grid Bottleneck: AI Devoured All the Compute — But Who’s Powering It?
“Geopolitical Edge” Investment Series
Every 1GW data center needs $1-2B in grid upgrades. Large transformer lead times are 3+ years. The US grid was built for 1970s load patterns — AI, EVs, and reshoring are hitting simultaneously.
I started researching photonics supply chains, trying to find the real data center bottleneck. The deeper I went, the clearer it got — the bottleneck isn’t silicon. It isn’t HBM. GPUs can be fast, optical modules abundant — without power, none of it runs.
A single 1GW hyperscale data center (one AWS campus, one Meta facility) needs $1-2B to rebuild the surrounding transmission infrastructure. Large power transformers — the industrial cousins of the ones on your neighborhood utility pole — have gone from 18-month lead times two years ago to 100+ weeks today. Only two domestic manufacturers still produce them at scale.
Then it hit me: the market prices these companies as industrials, but they’re not industrials. They’re infrastructure monopolies — customers have no alternative supplier, wait times start at 3 years, order visibility stretches 5-10 years. ETN’s 22%+ operating margin isn’t a cyclical peak — it’s the new normal when customers have nowhere else to go. PWR’s backlog is the largest in company history, and still growing.
The market sees demand (AI power consumption exploding — everyone knows). What the market isn’t pricing is that supply literally cannot respond — new transmission permitting takes 10-15 years, nobody can conjure transformer capacity out of thin air. This is a misread moat.
I ran the full fundamental workup on 10 grid-exposed stocks. The conclusion:
TL;DR: - Highest Conviction: Eaton (ETN) — Quality king, 22%+ operating margin, 21.6% ROE, data center + grid dual engine, beat estimates 4 quarters running - Best Backlog Visibility: Quanta Services (PWR) — #1 US transmission EPC, $35B+ backlog (largest in company history), irreplicable labor moat - Scarcest Asset: Constellation Energy (CEG) — Largest US nuclear fleet (23GW), Three Mile Island restart for Microsoft, entry window after 27% pullback - Best Deep Value: Vistra Energy (VST) — Forward P/E 14.8x (cheapest in the group), nuclear + battery + gas mix, direct beneficiary of Texas AI data center buildout - Highest Explosive Optionality: Talen Energy (TLN) — AWS-Susquehanna flagship nuclear deal, forward P/E 12.7x, high-leverage high-beta
Three Forces Driving the Grid Bottleneck
Force 1: Demand Explosion — Three Shocks Arriving Simultaneously
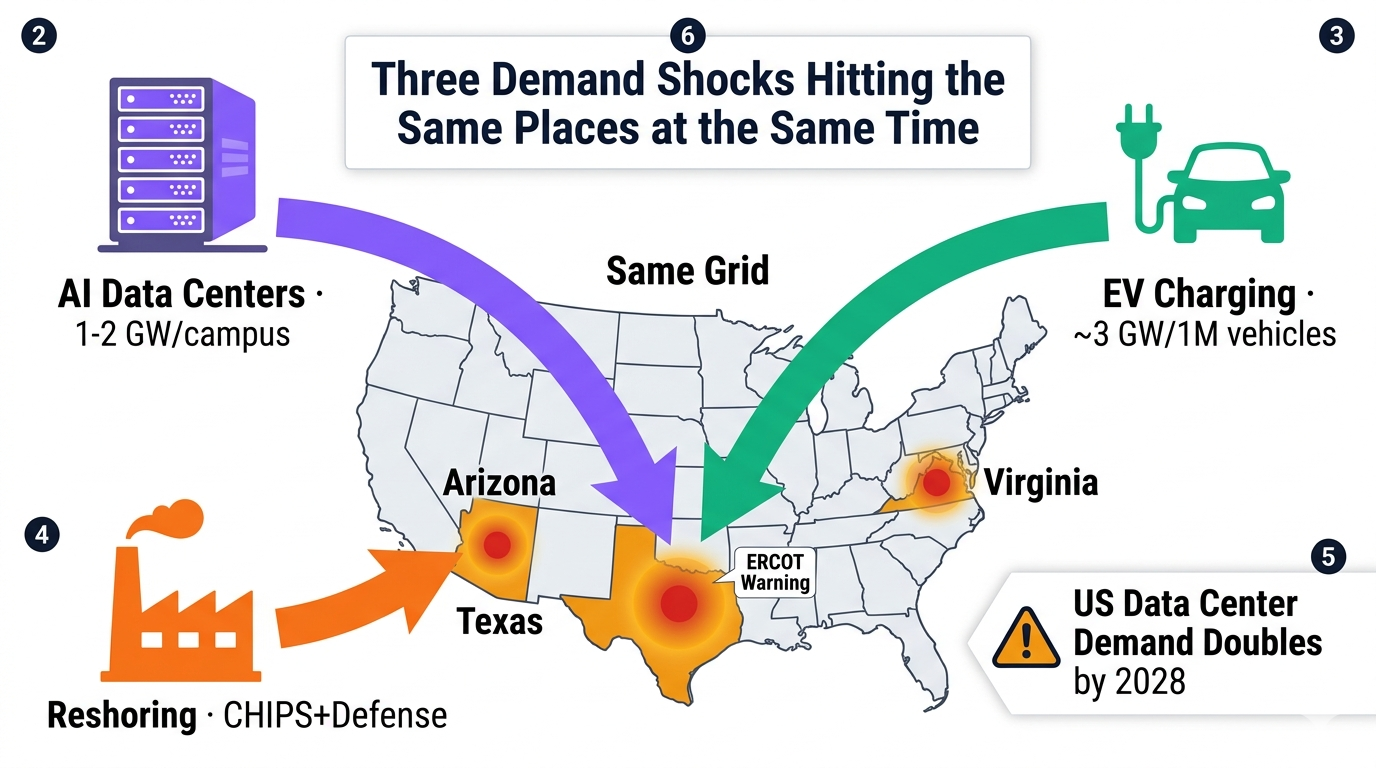
The market has absorbed the “AI uses power” narrative. But the real story is three independent demand curves all landing in 2025-2030:
- AI data centers — 1-2 GW per hyperscale campus, total US data center demand doubling by 2028
- EV charging — every 1M EVs requires ~3 GW of grid capacity, fast-charging networks accelerating
- Manufacturing reshoring — CHIPS Act fabs, defense production expansion, supply chain repatriation, each requiring industrial-grade power
Key insight: these three demand streams aren’t independent — they stack on the same geographies. Texas, Virginia, Arizona — AI data centers, EV factories, semiconductor fabs all compete for the same grid. ERCOT in Texas approaching blackout conditions in summer 2024 wasn’t an accident — it was a systemic warning.
Force 2: Supply Paralysis — The Grid Physically Cannot Respond
This is the variant view at the core of this piece. Everyone sees demand exploding, but almost nobody fully grasps how locked supply is:
- Large power transformers: 3+ year lead times — only 2 domestic manufacturers in the US, split between GEV (GE Vernova) and Hitachi Energy. Order a 138kV transformer today, it ships in 2029.
- Transmission line permitting: 10-15 years average — interstate transmission has to clear FERC, state PUCs, environmental review, tribal land consultation, NIMBY litigation. The SunZia project took 18 years from application to completion.
- The US has built essentially no major new interstate transmission in a decade — grid topology is frozen at Obama-era configuration.
- 25% of utility lineworkers retiring within 5 years — lineworkers require 4-year apprenticeships, this workforce cannot be conjured. This is PWR’s core moat.
Direct consequence of locked supply: prices rise, queues lengthen, bargaining power accrues upstream to equipment and EPC vendors. ETN’s gross margin expanded from 33.2% in 2022 to 37.6% in 2025. This isn’t cyclical — it’s structural.
Force 3: The Nuclear Bridge — The Only Baseload That Can Respond in Under 5 Years
Once you realize the grid can’t be built and gas turbines are booked through 2028, nuclear suddenly becomes the only answer.
- CEG restarting Three Mile Island Unit 1 for Microsoft — 20-year PPA above market pricing. This is a template, not an outlier.
- TLN’s Susquehanna nuclear plant feeding AWS directly — single transaction rewrote the valuation model for nuclear IPPs.
- Nuclear’s permitting advantage: existing unit life extensions, power uprates (MURs), retired unit restarts — no new construction permits required, online within 5 years.
This thread was covered in depth in my Nuclear Renaissance piece. Here the focus is nuclear’s unique role in the “grid bottleneck” narrative — it’s the only incremental supply not dragged by transmission bottlenecks (it’s sited near data centers, doesn’t require long-distance transmission).
CEG, VST, TLN appear in both pieces for exactly this reason.
Where the Money Is: Grid Infrastructure Profit Pools
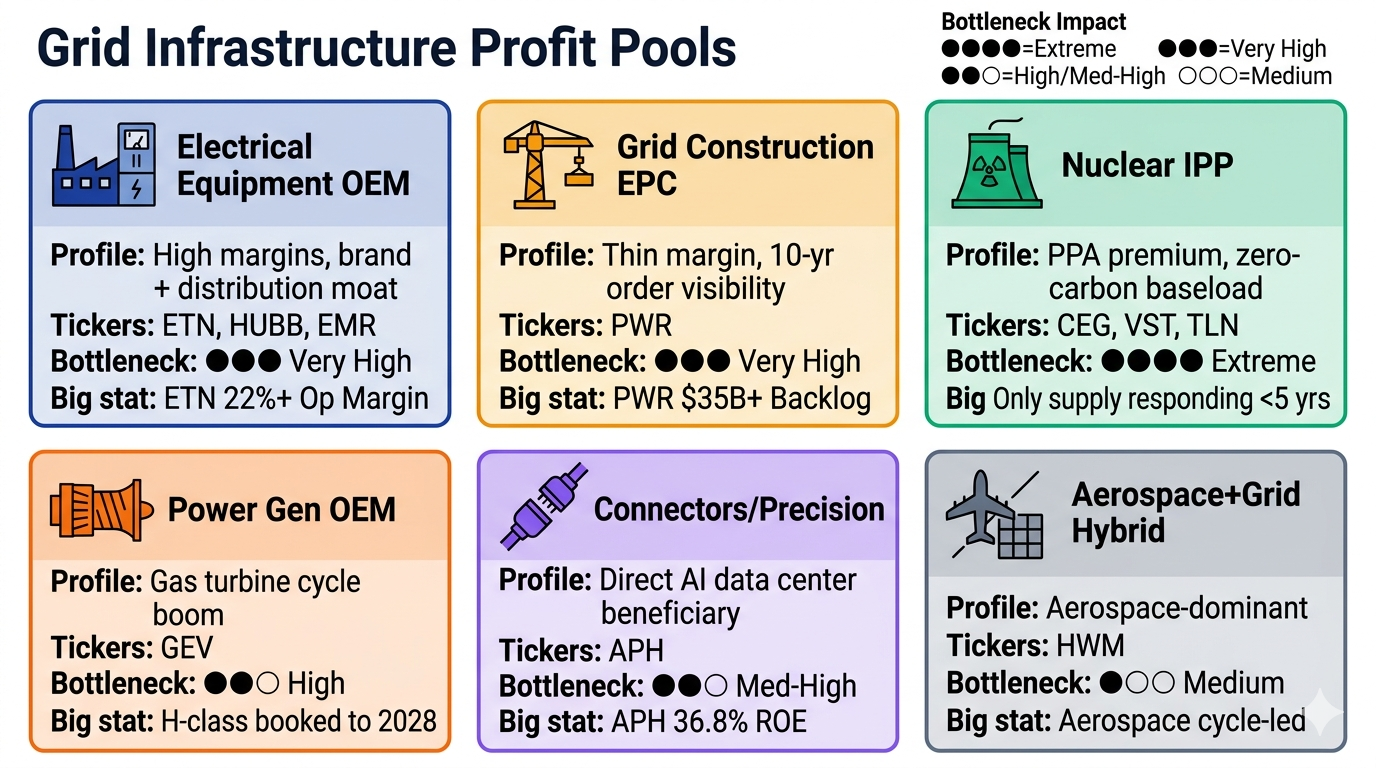
| Subsector | Profit Profile | Key Tickers | Bottleneck Impact |
|---|---|---|---|
| Electrical Equipment OEM | High margins, brand + distribution moat | ETN, HUBB, EMR | Very high — transformers, switchgear at 100+ week lead times |
| Grid Construction EPC | Thin margin but 10-year order visibility | PWR | Very high — irreplicable labor moat |
| Nuclear IPP | Structural PPA premium, zero-carbon baseload | CEG, VST, TLN | Extreme — only incremental supply responding in <5 years |
| Power Generation OEM | Gas turbine cycle explosion | GEV | High — H-class gas turbines booked through 2028 |
| Connectors/Precision Components | High margin, direct AI data center beneficiary | APH | Medium-high — AI data center connector demand doubling |
| Aerospace + Grid Hybrid | Primarily aerospace, grid is secondary | HWM | Medium — mostly aerospace cycle-driven |
Power Rankings: Full Analysis of 10 Grid Stocks
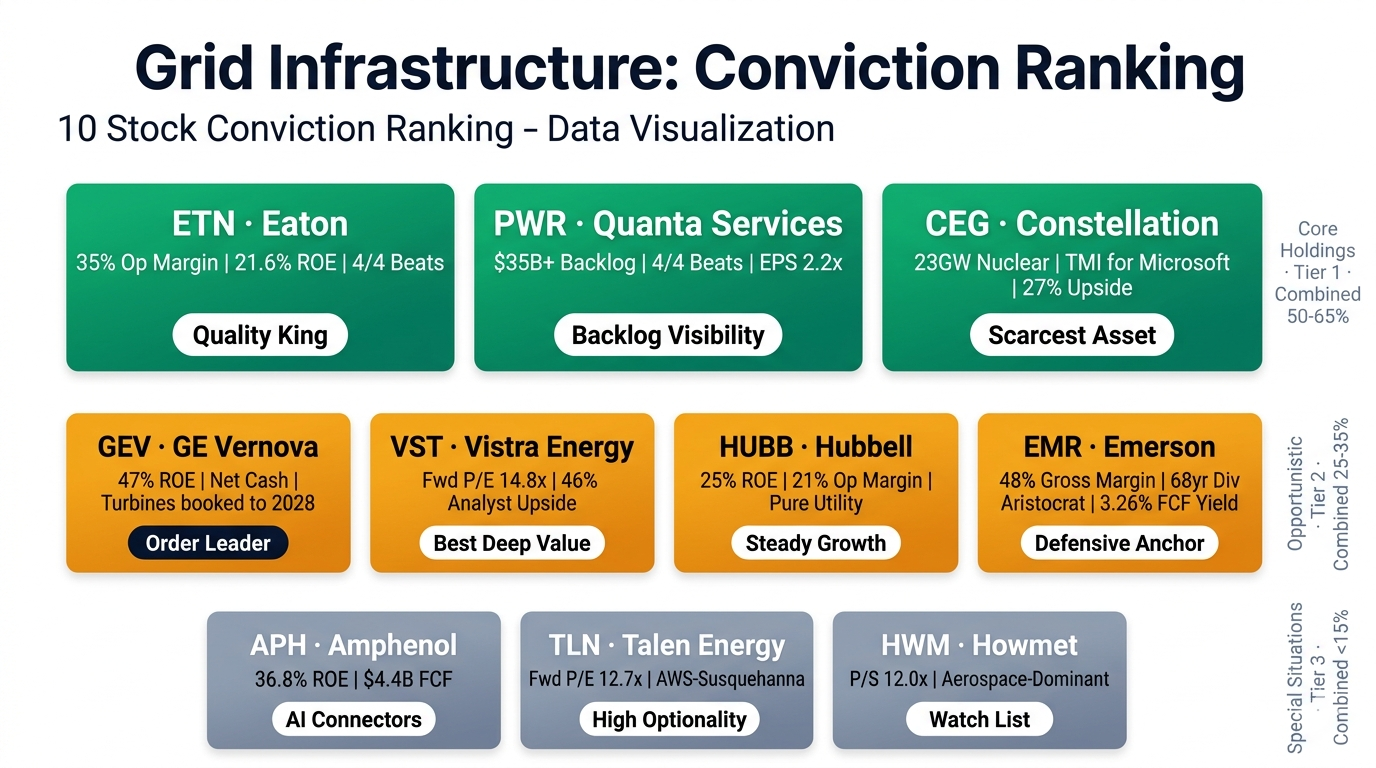
Tier 1: Core Holdings
Eaton — ETN | $392.73 | Market Cap: $152.37B
Quality King — Cleanest AI Grid Story
| Metric | Value | Signal |
|---|---|---|
| P/E (TTM) | 37.6x | Premium |
| Forward P/E | 25.6x | 32% compression — earnings acceleration |
| EV/EBITDA | 25.2x | Elevated |
| Gross Margin | 37.6% | Expanded 400bps 2022→2025 |
| Operating Margin | 19.8% | Best-in-class electrical OEM |
| Net Margin | 14.9% | Consistent |
| ROE | 21.6% | Industry-leading |
| FCF | $3.55B | Robust |
| D/E Ratio | 0.55 | Conservative |
| Current Ratio | 1.32 | Adequate |
| Analyst Consensus | Buy, $415.80 | 6% upside |
| Consecutive Beats | 4/4 quarters | 100% beat rate |
Bull Case: ETN is the cleanest way to own the AI grid buildout without single-customer risk. Electrical segment (~60% of revenue) is growing double-digits on the back of hyperscale data center power distribution orders — switchgear, UPS, busway, medium-voltage gear. Three structural tailwinds: (1) AI data center power demand — ETN wins regardless of which chip ships; (2) transformer/switchgear lead times of 100+ weeks give incumbents pricing power; (3) utility capex in a 10-year upcycle. Operating margin at 19.8% has another ~300bps of runway. Management committed to 2x data center capacity by 2028. Four consecutive beats + EPS accelerating (+19% Q1→Q4).
Bear Case: Priced for perfection. At 25x forward / 25x EV/EBITDA, any hyperscaler capex digestion (even a one-quarter pause) compresses the multiple 20-30%. Still ~35% exposure to vehicle, aerospace, eMobility. Competition from Schneider Electric and ABB in Europe, Siemens in medium-voltage gear. A repeat of 2000-era Cisco (right trend, wrong multiple for the holding period) is the tail risk.
Verdict: Highest Conviction. 22%+ operating margin + 21.6% ROE + fortress balance sheet + data center + grid dual engine + transformer moat = best risk-adjusted return in the group. Only issue is entry price — building positions below $380 is more ideal.
ETN is the quality king. But what if what you want isn’t “high-quality compounding” but “backlog visibility”? The next name’s order backlog is the largest in company history — and still growing.
Quanta Services — PWR | $587.42 | Market Cap: $87.89B
Transmission EPC Leader — Largest Backlog in Company History
| Metric | Value | Signal |
|---|---|---|
| P/E (TTM) | 86.5x | Very high (cyclical ramp) |
| Forward P/E | 38.4x | 55% compression — EPS doubling expected |
| EV/EBITDA | 36.3x | Richest EPC multiple in decades |
| Gross Margin | 13.3% | Normal for large-scale EPC |
| Operating Margin | 5.9% | Services margin ceiling |
| ROE | 12.7% | Recovering from 8-10% range |
| FCF | $1.62B | Growing with revenue |
| D/E Ratio | 0.72 | Manageable |
| Consecutive Beats | 4/4 quarters | EPS up 2.2x |
| Analyst Consensus | Buy, $620.59 | 6% upside |
Bull Case: PWR is the only entity in North America with the labor force (~50,000+ craft workers), fleet, and right-of-way relationships to execute utility-scale transmission at the pace now being demanded. Backlog of $35-36B+, with 12+ years of forward visibility. The labor moat is real — lineworker apprenticeships are 4-year programs, no one can spin up capacity to match. Three structural tailwinds: (1) the 70-year-old transmission grid is capacity-constrained — every data center, EV fast-charger network, and solar farm needs interconnection upgrades Quanta performs; (2) hardening/undergrounding programs post-wildfire litigation drive unit pricing higher; (3) LNG export buildout + reshoring drives incremental gas-fired generation that needs the same T&D integration.
Bear Case: 38x forward P/E is in the 95th percentile of the company’s history. Any cost overrun on a marquee fixed-price contract (Transource or SunZia-style mega-projects) hits EPS hard at thin margins. Lineworker labor inflation of 6-8% per year has compressed margins for smaller competitors — Quanta has absorbed it through pricing but the cushion is narrowing. The stock has tripled since 2023 — valuation is the main bear.
Verdict: Best Backlog Visibility. 10-year visible contract book + irreplicable labor moat + largest backlog in company history = pure “picks-and-shovels” play. The EPS-doubling expectation is built on signed contracts, not hopes. $550-570 is a safer add zone.
Constellation Energy — CEG | $299.14 | Market Cap: $108.38B
Largest US Nuclear Fleet — The Three Mile Island AI Bridge
| Metric | Value | Signal |
|---|---|---|
| P/E (TTM) | 40.4x | Elevated |
| Forward P/E | 21.9x | 46% compression |
| EV/EBITDA | 17.2x | Mid-range |
| Gross Margin | 17.4% | Normal for wholesale power |
| Operating Margin | 15.0% | Nuclear premium (far above peers) |
| ROE | 16.8% | Strong for capital-heavy business |
| FCF | $1.29B | Positive again post-2024 capex cycle |
| Cash | $3.3B | Fortress |
| D/E Ratio | 0.65 | Conservative |
| Dividend Yield | 0.58% | Small but growing |
| Beta | 1.14 | Higher than regulated utilities |
| Analyst Consensus | Strong Buy, $381.06 | 27% upside |
Bull Case: CEG is the scarcest asset in US power. 23GW of zero-carbon nuclear baseload is literally irreplaceable — the NRC hasn’t licensed a new large reactor since 2012, and Vogtle’s AP1000 units coming in massively over budget illustrate why. The Microsoft deal to restart Three Mile Island Unit 1 (20-year PPA at premium pricing) is the template for the entire thesis: hyperscalers will pay structural premiums for 24/7 clean baseload. 2030 earnings power looks meaningfully higher than consensus once TMI comes online, MUR upgrades add ~800MW over five years, and remaining fleet rolls off sub-market legacy contracts into market or PPA pricing. 21.9x forward for an asset base with structural pricing power and essentially no supply response is reasonable. Uprated nuclear earning $90-110/MWh blended — over 60% of data center demand now contracting in that corridor. The Production Tax Credit ($43/MWh floor) eliminates downside tail risk.
Bear Case: The stock ran from $85 (2022 IPO) to $412 (peak 2025) — a 4.8-bagger that priced in significant good news. The 27% pullback to $299 may just be mean-reversion halfway there. Operational risk isn’t zero: a single long-term outage at Braidwood or Byron (600-1100MW each) hits EPS for 6-12 months. Counterparty concentration to hyperscalers creates nonlinear risk if the AI capex narrative cools.
Verdict: Scarcest Asset. Largest US nuclear fleet + TMI restart + data center PPA pricing template = long-cycle monopoly-level pricing power. The 27% pullback is a rare entry window. Also covered in the Nuclear Renaissance piece — here it’s the “grid bottleneck” angle.
Tier 2: Opportunistic Positions
The three above are close-your-eyes-and-hold core positions. The next four are different — each is a bet on something specific happening.
GE Vernova — GEV | $978.32 | Market Cap: $263.69B
The Gas Turbine + Grid Equipment Pure-Play Spinoff
| Metric | Value | Signal |
|---|---|---|
| P/E (TTM) | 55.0x | Premium growth multiple |
| Forward P/E | 43.1x | Still elevated |
| EV/EBITDA | 94.8x | Extreme — EBITDA still normalizing |
| Gross Margin | 20.3% | Low but expanding rapidly |
| Operating Margin | 4.9% | Early cycle |
| Net Margin | 12.8% | Boosted by 2025 one-time items |
| ROE | 47.1% | Highest in group (small equity base) |
| D/E Ratio | 0.11 | Net cash |
| FCF | $3.71B | Accelerating |
| Analyst Consensus | Strong Buy, $956.61 | Slightly below spot |
Bull Case: GEV owns the one business where AI-era demand has a bottleneck GE can monetize: large-frame gas turbines. H-class and 7HA units have 3-4 year lead times, and the orderbook is at record highs. New gas turbine pricing has moved up 20-30%, and the services attach rate (decades of aftermarket revenue per installed turbine) makes each unit a 30-year annuity. The Electrification segment (high-voltage transformers, switchgear) has similar lead-time dynamics — Vernova is one of only three Western suppliers. Wind remains a drag but offshore orders have reset lower. Margin expansion has years to run: Power segment can do mid-teens operating margin vs ~8% today.
Bear Case: Valuation has already priced a lot. 43x forward P/E for a business with structural 20% gross margin is steep — any execution wobble in Vernova of Power (gas turbines) or Electrification (transformers) hits the multiple. Wind losses could re-accelerate if offshore supply chain misses on the revised orderbook. 2025 net income was flattered by one-time items. The stock tripled in 18 months post-spin.
Verdict: Backlog Visibility Premium. Net-cash balance sheet + 47% ROE + record-high orderbook = high quality but fully priced. Wait for $850-900 pullback.
Vistra Energy — VST | $165.53 | Market Cap: $56.04B
Texas IPP — Cheapest Forward P/E in the Group
| Metric | Value | Signal |
|---|---|---|
| P/E (TTM) | 75.6x | Inflated by earnings mix shift |
| Forward P/E | 14.8x | 80% compression — cheapest in group |
| EV/EBITDA | 18.1x | Mid-range |
| Gross Margin | 17.7% | Commodity-typical |
| Operating Margin | 8.1% | Below CEG |
| ROE | 17.7% | Good |
| D/E Ratio | 4.00 | Highest in group |
| Current Ratio | 0.78 | Tight — watch |
| Beta | 1.52 | Highest operating leverage in group |
| Analyst Consensus | Strong Buy, $241.06 | 46% upside |
Bull Case: Vistra is the most leveraged non-pure-nuclear bet on the AI grid demand curve (in Texas). Comanche Peak (2.4GW nuclear) is de-facto equivalent to CEG’s fleet on a per-MW basis, and the state’s regulatory posture (ERCOT is the Wild West of merchant markets) means any data center wanting 24/7 clean baseload in Texas starts here. Vistra Vision is the company’s branded approach to front-of-the-meter data center deals — management has cited significant hyperscaler discussions. Battery portfolio (Moss Landing, Texas) creates dispatchable capacity that captures peaker-plant pricing. At 14.8x forward, you’re paying materially less than CEG for arguably comparable upside per dollar of market cap. 25% pullback from highs is your entry discount.
Bear Case: D/E of 4.0 and current ratio of 0.78 are the worst combination in the group. Any merchant price shock (mild summer, hedge losses, gas price spike) hits EPS faster than peers. The Moss Landing battery fire (2025) reminds investors that non-nuclear assets carry operational tail risk. Texas regulatory environment can swing hostile. Q1 loss reminds investors this is NOT a utility.
Verdict: Best Deep Value. 14.8x forward P/E + 46% analyst upside + nuclear + battery + gas triple-stack = high-operating-leverage AI power bet. Accept higher volatility.
Hubbell — HUBB | $521.71 | Market Cap: $27.66B
Utility Distribution Pure-Play — 21% Operating Margin
| Metric | Value | Signal |
|---|---|---|
| P/E (TTM) | 31.3x | Slightly above historical |
| Forward P/E | 24.2x | Reasonable |
| Gross Margin | 35.6% | Strong |
| Operating Margin | 21.1% | Near top of group |
| ROE | 25.1% | Best in Tier 2 |
| FCF | $0.87B | Solid |
| D/E Ratio | 0.65 | Conservative |
| Current Ratio | 1.72 | Strong |
| Dividend Yield | 1.10% | Meaningful |
| Analyst Consensus | Buy, $540.50 | 4% upside |
Bull Case: Hubbell is the purest-play Tier-1 beneficiary of the utility capex supercycle. Utility Solutions segment (~60% of revenue) sells directly into IOU and public power capex cycles — pole-top transformers, voltage regulators, metering, connectors. The 10-15 year grid replacement cycle means ~2x historical unit demand for the next decade. Unlike ETN which blends aerospace/vehicle volatility, Hubbell is ~85% electrical. Operating margin expansion (400bps since 2022) is the tell — pricing power is real and structural. Smaller market cap = easier M&A upside (or to be acquired). Less “crowded trade” feel than ETN.
Bear Case: Less direct data center pull than ETN. If hyperscaler capex is the headline driver, Hubbell benefits indirectly (utility interconnect) but doesn’t get premium framing. Competition from ABB, Siemens, and private-label utility brands on distribution equipment. 31x trailing multiple has no margin of safety if utility capex rates normalize.
Verdict: Steady Growth Play. Purest utility capex play + 21% operating margin + steady dividend = if you want execution over story. Suitable for defensive positioning during volatility.
Emerson Electric — EMR | $140.37 | Market Cap: $78.93B
Industrial Automation + Measurement — Dividend Aristocrat in Transition
| Metric | Value | Signal |
|---|---|---|
| P/E (TTM) | 34.3x | Elevated |
| Forward P/E | 19.6x | 43% compression |
| Gross Margin | 48.0% | Highest in group (software/measurement mix) |
| Operating Margin | 19.9% | Strong |
| ROE | 11.3% | Below peers |
| FCF | $2.58B | Strong |
| FCF Yield | 3.26% | Best in group |
| Dividend Yield | 1.57% | 68-year consecutive increase streak |
| Current Ratio | 0.84 | Below 1 — watch |
| Analyst Consensus | Buy, $167.23 | 19% upside |
Bull Case: Emerson’s pivot from mixed industrial conglomerate to automation/measurement pure-play (post-Copeland divestiture, post-NI acquisition) has created a higher-margin, data center-relevant business model. NI’s software/measurement business has ~70% gross margin; integration with Emerson’s distributed control systems creates a stack that serves power generation (nuclear, gas), LNG export facilities, and process industries. 48% gross margin is the highest in the group — indicates software/services mix is material. Less cyclical than ETN/HUBB. Dividend aristocrat (68-year streak) provides downside protection. 3.3% FCF yield on a quality compounder is reasonable.
Bear Case: Less direct grid demand pull than ETN/HUBB. Automation is a second-derivative beneficiary — needs the underlying capex cycle to actually spend. NI integration has been slower than bulls expected; synergy capture still in the 50-60% realized range. Current ratio below 1 is unusual for a dividend aristocrat.
Verdict: Defensive Anchor. Dividend aristocrat + 48% gross margin + NI integration catalyst = not the most exciting story, but a stabilizer in volatile markets. EMR also appears in the upcoming Robotics & Automation piece — two angles on industrial automation.
Tier 3: Special Situations
The last three I hesitated to include — each has a unique asymmetric angle but doesn’t belong as a core position.
| Name | Price / Mkt Cap | Core Bet | Key Metrics | Biggest Risk | Verdict |
|---|---|---|---|---|---|
| TLN $362.40 | $16.45B | AWS-Susquehanna deal economics validate, 2026 EPS explosion | Forward P/E 12.7x (lowest in group), 68% gross margin | D/E 6.24, single-asset concentration (80%+ from Susquehanna) | <3% position. High explosive optionality but balance sheet not fully healed |
| HWM $247.60 | $99.27B | Aerospace cycle + edge grid hardware exposure | Operating margin 25.8%, ROE 30.4% | Primarily an aerospace stock priced at cycle-peak multiples | Watch. Grid exposure only 5-10% of revenue, aerospace-dominant |
| APH $148.96 | $183.10B | Data center connector demand doubling, pure AI infrastructure beneficiary | Operating margin 25.9%, ROE 36.8%, FCF $4.38B | 28.8x forward P/E and heavy hyperscaler capex dependence | Opportunistic add. Cleanest AI infrastructure connector beneficiary |
TLN is the “brightest bet, highest risk” of the three — if you believe the AWS-Susquehanna deal economics get FERC blessing at original terms, 2026 EPS upside is significant; if terms get renegotiated, the leverage amplifies downside.
Variant View
Market consensus: These are utilities and industrials — price them on P/E and dividend yield. The AI power demand theme is fully priced in.
Our view: The market is using the wrong comp set. These aren’t utilities — they’re infrastructure monopolies sitting on 3+ year backlogs with pricing power. ETN’s 22%+ operating margin isn’t a cyclical peak — when your customers have no alternative supplier and a 3-year wait, this is the new normal. PWR’s backlog is the largest in company history and still growing. The market sees the demand; what it’s NOT pricing is the permitting bottleneck that gives these companies a decade-long moat.
Why the market is wrong: 1. Analysts still use utility valuation models — their frameworks assume utility pricing constrained by regulatory caps, but these companies now derive 70%+ of revenue from non-regulated counterparties (data center PPAs, industrial direct contracts). They’ve detached from utility pricing. 2. Operating margin expansion at ETN and HUBB is read as cyclical — it’s actually structural. As long as transformer lead times exceed 18 months, this margin is the baseline. 3. Nuclear PPA pricing has been re-rated — CEG and TLN contracts with hyperscalers are at $90-115/MWh, materially above merchant market averages. The market is still using 5-year-old nuclear valuation models on these two.
6 Investment Philosophy Perspectives
| Perspective | Conclusion | Core Rationale | Biggest Risk |
|---|---|---|---|
| 🏦 Quality Compounding (Buffett/Munger) | LONG ETN + HUBB | ETN’s 22% operating margin + 21.6% ROE + fortress balance sheet. HUBB’s 25% ROE + pure utility exposure. Both holdable for 10 years | Rate rises compress multiples; competition from Schneider/ABB intensifies |
| 🚀 Imaginative Growth (Baillie Gifford) | LONG GEV + CEG | GEV owns the global gas turbine bottleneck, each unit a 30-year annuity. CEG is irreplicable nuclear baseload — AI-era scarcity can’t be replaced | GEV wind losses re-accelerate; CEG single-unit long-term outage |
| 📈 Fundamental L/S (Tiger Cubs) | LONG VST | 14.8x forward P/E cheapest in group, 46% analyst upside — largest consensus gap | High debt + Texas ERCOT regulatory risk + merchant price volatility |
| 💎 Deep Value (Klarman) | LONG TLN + VST | TLN forward P/E 12.7x (cheapest in group), Susquehanna-AWS deal can rewrite valuation. VST’s deep value stack | TLN single-asset concentration + balance sheet not healed; VST leverage |
| ⚡ Catalyst-Driven (Tepper/Ackman) | LONG PWR | Largest backlog in history + labor moat + clear 2026-2027 EPS doubling path | Large fixed-price contract cost overruns |
| 🌍 Macro Tactical (Druckenmiller) | LONG the entire sector (heavy nuclear + EPC) | AI + EV + reshoring triple demand stack + permitting bottleneck = 10-year structural mismatch. Nuclear and EPC are the purest supply-scarcity plays | AI capex unexpectedly slows; rate spike crushes utility capex |
6/6 perspectives are LONG — each framework points to different preferred names, but the direction is unanimous: long the grid bottleneck.
Pre-Mortem: If We Lose Money in 2 Years
Failure Path A (~25% probability): AI Capex Slowdown - Hyperscalers cut data center buildouts by 30%, backlog stops growing or declines - ETN/APH data center revenue decelerates, premium multiples compress - CEG/TLN hyperscaler PPA negotiations delay or reprice - Warning signals: Microsoft/Google/Meta quarterly capex growth turns to single digits; Equinix/Digital Realty order growth slows
Failure Path B (~15% probability): Rate Spike Crushes Utility Capex - 10-year Treasury breaks 5.5%, utility financing costs spike - IOUs defer capex plans, HUBB/PWR backlog growth slows - Warning signals: 10-year Treasury breaks 5.5% and sustains; utility CDS spreads widen
Failure Path C (~10% probability): Breakthrough Permitting Reform - Congress passes transmission permitting reform, 10-15 year timelines compress to 5-7 years - PWR’s labor moat partially erodes (new entrants can ramp faster) - Warning signals: FERC Order 2023 implementation ahead of schedule; Congress advances NEPA reform
Action Triggers
| Signal | Action | Ticker |
|---|---|---|
| ETN pulls back below $380 | Initiate or add | ETN |
| CEG drops below $280 | Add (second leg after 27% pullback) | CEG |
| PWR pulls back to $550-570 | Initiate | PWR |
| VST breaks above $180 (consolidation breakout) | Breakout add | VST |
| TLN’s AWS-Susquehanna original terms blessed by FERC | Major add | TLN |
| 10-year Treasury breaks 5% | Trim utility exposure, rotate to ETN/PWR | EMR/HUBB → ETN/PWR |
| Microsoft/Meta capex YoY growth < 10% | Trim entire sector | All |
| Transformer lead times drop below 18 months | Re-evaluate entire thesis | All |
Portfolio Construction Guide
Core (50-65%): ETN 20-25% | PWR 15-20% | CEG 15-20% Opportunistic (25-35%): VST 10-15% | GEV 5-10% | HUBB 5-10% | EMR 5-10% Satellite (<15%): APH 5-8% | TLN 2-3% Watch List: HWM (grid relevance low, aerospace-dominant)
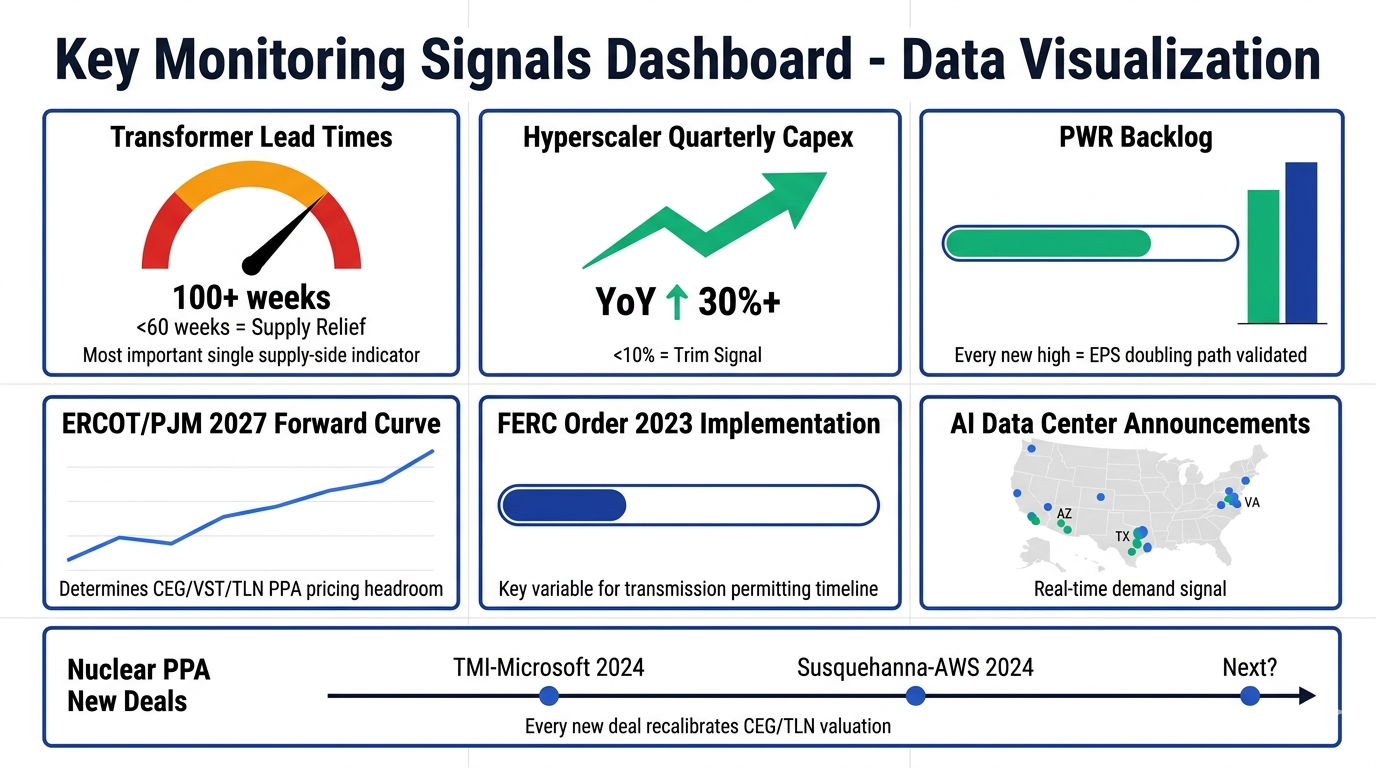
Key Signals to Monitor
- Large transformer lead times — drop from 100+ weeks to below 60 weeks = supply relief signal
- Hyperscaler quarterly capex — AWS/Azure/GCP YoY growth is the leading indicator for AI-grid demand
- PWR backlog — every quarterly new high = EPS doubling path validated
- ERCOT/PJM power price curves — 2027 forward curve direction determines CEG/VST/TLN PPA pricing runway
- FERC Order 2023 implementation — the key variable affecting transmission permitting timelines
- AI data center announcements — new campus announcements (especially Texas/Virginia/Arizona) are real-time demand signals
- Nuclear PPA new deals — any new “nuclear + data center” transaction recalibrates CEG/TLN valuation
Data as of: April 16, 2026. All valuations based on closing prices that day. Fundamental data sourced from Finviz / StockAnalysis.com / Yahoo Finance.
Disclaimer: This article is for educational and research purposes only, and does not constitute investment advice. The author may hold positions in some of the securities mentioned.