May 1, 2026
9 Wins, 1 Loss, And A New Story: Precious Metals 5-Week Recheck
Five weeks after the bottom call: 9 of 10 stocks up +7% avg, FNV the only loser as predicted. The new story isn't gold price — it's the capital-return supercycle (NEM's $6B buyback, AEM's A- credit). Plus: silver's hidden demand crack and the trade for the next leg.
9 Wins, 1 Loss, And A New Story: Precious Metals 5-Week Recheck
“Geopolitical Edge” Series, Part 3 · Follow-up
Five weeks ago I said the $4,520 pullback was the entry. Today gold is $4,644, nine of ten stocks are up, and the basket averages +7.0%. This isn’t a victory lap — it’s an honest answer to two harder questions: (1) where was I right and where was I wrong, and (2) have the rules of the game changed?
The short answer: the framework held, but the protagonist of the story has changed. Three months ago, the driver was central-bank de-dollarization. Today, the driver is the mountain of free cash flow piling up at miners — and how they’re choosing to spend it.
TL;DR — 5-week scorecard
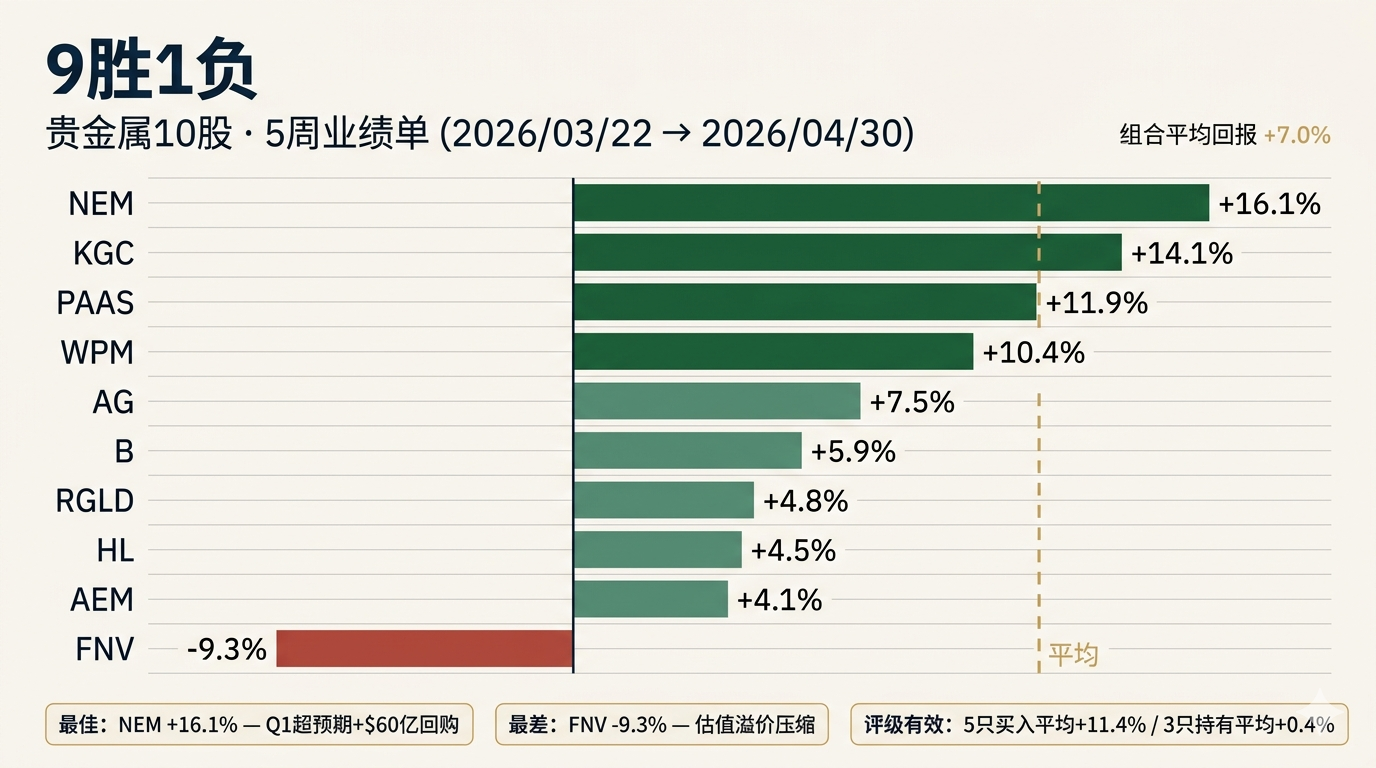
- 9 wins, 1 loss, +7.0% average. Top winners: NEM +16.1% (Q1 EPS $2.90 vs $2.19 consensus, new $6B buyback), KGC +14.1% (record $838M FCF), PAAS +11.9%.
- Only loser: FNV −9.3%. But the prior article rated it “Hold” specifically because “DCF was significantly overvalued.” The warning paid off. Framework held.
- The bottom held as expected. Of four scenarios, “current range” (gold $4,500, 40% prob) is the one that played out. No stop hit, no trim level reached.
- Three factual corrections from the prior article: Gold’s all-time high was $5,589 on January 28, 2026 (not $5,321 on March 3); the operation is “Operation Epic Fury” (not “Epic Wrath”); Barrick now trades as “B” (changed May 2025, no longer “GOLD”). These don’t change the conclusions, but accuracy matters.
- A new dominant theme: the capital-return supercycle. Newmont’s new $6B buyback. Agnico Eagle upgraded by Fitch to A− (a rare IG+ in mining). Kinross margins +92% YoY. Q1 free cash flow blew the doors off across the sector — and miners are sending the cash back through buybacks, dividends, and M&A.
- Risk ranking has shifted. The prior article listed three ways to lose money. The new #1 isn’t “Fed wins the inflation war” — it’s “silver industrial demand undershoots,” because the Silver Institute just cut 2026 photovoltaic silver demand by 7-19%.
Part 1: The Scorecard — How Did The Calls Do?
1.1 The Performance Card (2026-03-22 → 2026-04-30, ~5.5 weeks)
| Stock | 3/22 Close | 4/30 Close | Move | Prior Rating | Levels Touched |
|---|---|---|---|---|---|
| NEM | $95.80 | $111.22 | +16.1% | Buy | Tagged $120.70 post-earnings 4/24 |
| KGC | $26.50 | $30.24 | +14.1% | Buy | None |
| PAAS | $46.73 | $52.29 | +11.9% | Buy | None |
| WPM | $115.00 | ~$127 | +10.4% | Buy | None |
| AG | $18.27 | $19.64 | +7.5% | Speculative Buy | Intraday tag of “Add” $17 |
| B (formerly GOLD) | $37.14 | $39.34 | +5.9% | Hold/Add on dip | None |
| RGLD | $225.07 | $235.80 | +4.8% | Hold | None |
| HL | $17.24 | $18.02 | +4.5% | Speculative Hold | Tagged “Add” $16 |
| AEM | $179.13 | $186.42 | +4.1% | Buy | None |
| FNV | $251.87 | $228.51 | −9.3% | Hold | Tagged “Add” $235 |
Key observation: the ratings sorted the returns. The five “Buy”-rated names averaged +11.4%. The three “Hold”-rated names averaged +0.4% (dragged by FNV). This is where the framework earned its keep — not all gold stocks moved together, and the rating screen had explanatory power.
1.2 The Bottom Held — Scenario 3 Won
The prior article assigned probabilities to four scenarios:
| Scenario | Gold | Silver | Probability | Reality |
|---|---|---|---|---|
| Deep Correction | $3,500 | $45 | 15% | ❌ Did not happen |
| Mild Pullback | $4,000 | $55 | 30% | ❌ Did not happen |
| Current Range | $4,500 | $70 | 40% | ✅ This is where we landed |
| New Highs | $5,500+ | $100+ | 15% | ❌ Not yet — but Hormuz re-escalation makes this closer |
Result: the highest-probability scenario hit. Gold went $4,520 → $4,644 (+2.7%); silver $72 → $73.65 (+2.3%). The prior article’s staged accumulation plan — “first 25% at $4,500 in WPM/RGLD” — was the right execution cadence. Tranches two and three (triggered at $4,000 and $3,800) never fired.
1.3 Why FNV Was The Only Loser — The “Hold” Rating Saved The Position
FNV didn’t drop because of fundamentals. FY2025 revenue was a record $1.823B, zero debt, $3.1B available capital. It dropped because of valuation.
The prior article said:
“DCF significantly overvalued (fair value $91 vs price $252). 47.9x P/E prices perfection. Analyst consensus of $233 implies 7.5% downside.” — Action: Hold.
Five weeks later: FNV $228.51, still far above the $91 DCF fair value, but right at the analyst consensus of $233. The market has begun compressing the royalty company’s “perfection premium.” If you followed “Hold” (no add), the loss was contained. If you bought the “Add” trigger at $235, you’re sitting on roughly −3% — survivable.
Lesson: in precious metals, valuation is not a secondary factor. When gold is sideways, multiple compression dominates returns. FNV’s 47.9x P/E required gold to keep moving up to defend itself; gold went +2.7% and the premium started leaking out.
1.4 The Capital-Return Supercycle — What Q1 Earnings Revealed
NEM, AEM, and KGC all reported Q1 2026 by April 30. All three beat. All three printed records.
Newmont (NEM) — April 23 after close - EPS $2.90 vs $2.19 consensus (+32% beat) - Revenue $7.31B; net income ~$3.26B - Free cash flow $3.1B — all-time quarterly record - New $6B buyback authorized (on top of a previously completed $6B program) - Stock +8.7% next session to $120.70
Agnico Eagle (AEM) — April 30 - Adjusted EPS $3.41; record adjusted net income $1.706B - Realized gold price $4,861/oz; production 825K oz - FCF $732M; net cash $2.9B - Fitch upgraded to A− — a rare IG+ rating in mining - 2026 guidance reaffirmed at 3.3-3.5 Moz, H2-weighted
Kinross (KGC) — April 30 - EPS $0.71 vs $0.68 consensus - Revenue $2.41B (+10.75% beat) - Net income $843M; record FCF ~$838M - Margins +92% YoY and +22% QoQ — outpaced the gold price gain over the same period
Still ahead (May catalysts): WPM (5/7), RGLD (5/6), PAAS (5/5), AG (5/6), HL (5/7), FNV (5/12), B (5/11, first under new CEO Mark Hill).
What this means: the three companies that have reported are all using cash flow for capital return — Newmont expanded its buyback by $6B, Agnico received a credit upgrade (which lowers future debt costs and frees more cash), Kinross expanded margins. Miners are no longer doing what they did in the 2010s — pouring profits into new mines, M&A bidding wars, and production growth. They are returning cash to shareholders. This is the most important structural change in this cycle, and the dominant question heading into the May earnings cluster.
1.5 Three Factual Corrections
Self-consistency in writing matters, but facts matter more. Three things in the prior article need correcting:
- Gold’s ATH was not $5,321 on 2026-03-03 — it was $5,589 on 2026-01-28. What followed in March was the worst month for gold since June 2013 (>10% decline), bottoming around $4,500 — which is where the prior article picked up the story.
- The operation is “Operation Epic Fury,” not “Epic Wrath.” The joint US-Israel campaign launched February 27-28; Khamenei was assassinated on February 28. The two-week ceasefire reached on April 8 has since broken down.
- Barrick now trades as “B” on NYSE, not “GOLD” — the change took effect in May 2025. Continuing to use “GOLD” was historical habit, not accuracy.
These corrections don’t change the investment conclusions — gold is in that range, the Hormuz crisis is real, Barrick’s fundamentals haven’t shifted — but errors of fact get fixed.
Part 2: The Rules Have Changed — Three Things About The Next Leg
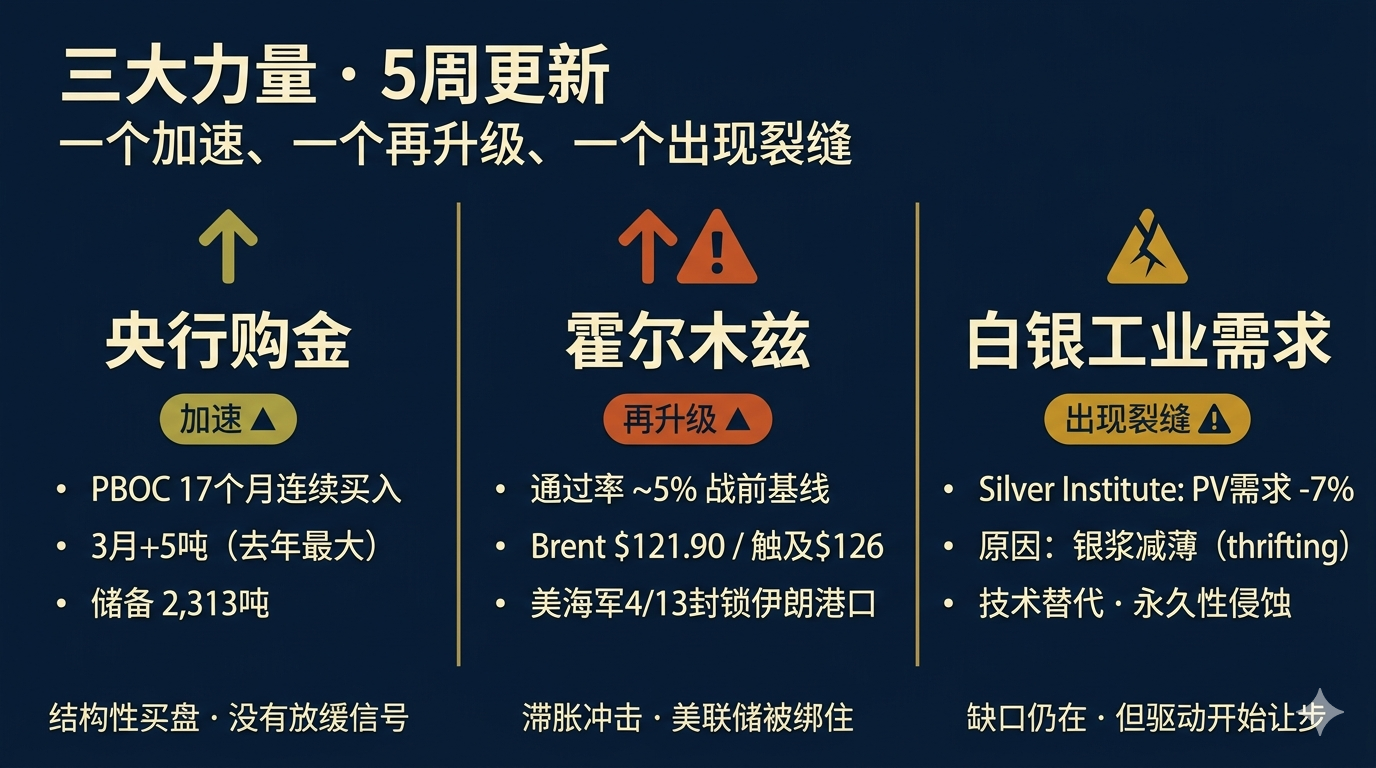
2.1 The Three Forces Update — One Accelerating, One Re-Escalating, One Cracking
Force 1: Central-bank buying — accelerating. - PBOC has now bought gold for 17 consecutive months (the prior article said 15) - March 2026 single-month purchase: 5 tonnes — the largest since February 2025 - Reserves now 2,313 tonnes; gold at ~9% of FX reserves - Q1 2026 cumulative +7 tonnes — the strongest Q1 since Q1 2025 - No deceleration signal anywhere — the structural bid keeps accelerating
Force 2: Hormuz — worse, not better. The prior article called the “Hormuz paradox” temporary. Five weeks later, the other side of the paradox is materializing: the crisis is escalating and the safe-haven bid is starting to overwhelm the rate headwind. - April 8 ceasefire → April 9 violation → IRGC re-closed the strait - April 13: US naval blockade of Iranian ports (38+ vessels turned back) - April 18: Iran formally re-declared closure - Late April: VLCC Sanmar Herald and other tankers fired upon - Strait throughput at ~5% of pre-war baseline; ~2,000 ships stranded - Brent crude $121.90/bbl; intraday $126
This is not “priced in.” It’s an intensifying stagflation shock. The April 29 FOMC statement explicitly named the Middle East war as a source of inflation pressure but held rates at 3.50-3.75% (8-4 vote, the most dissent since 1992). This combination — high oil + Fed pinned in place — is the textbook macro environment for gold.
Force 3: Silver industrial demand — a real crack appears. This is the biggest negative shift in five weeks. The Silver Institute’s 2026 World Silver Survey cut 2026 photovoltaic silver demand by 7% (some estimates as much as 19%) to about 194 Moz. The reason isn’t slowing solar deployment — it’s silver paste thrifting: solar manufacturers are using less silver per cell while getting equivalent performance.
| Silver Demand Component | Prior Article (March) | Silver Institute (April) | Change |
|---|---|---|---|
| Photovoltaic | 120-125 Moz | ~194 Moz but YoY −7% | Larger absolute, growth reversed |
| Electric Vehicles | 70-75 Moz | ~65-70 Moz | Slightly below estimate |
| AI/Data Centers | “fastest growing” | Growing but small relative to PV | Confirmed but not enough to substitute |
| Total Deficit (2026) | 67 Moz | 67 Moz confirmed | Same number, more fragile sources |
Conclusion: the deficit is intact, but the demand structure feeding it is starting to give way. The six-consecutive-year deficit story remains, but 2026’s deficit is mainly held up by the supply side (mine permitting and ramp times are long), not by demand continuing to surge. For long-term silver miner positions this is a moderate negative — it doesn’t kill the thesis but it argues for tempering optimism on silver versus gold.
2.2 The “Great Decoupling” — Same Gold Price, 25-Point Spread In Returns
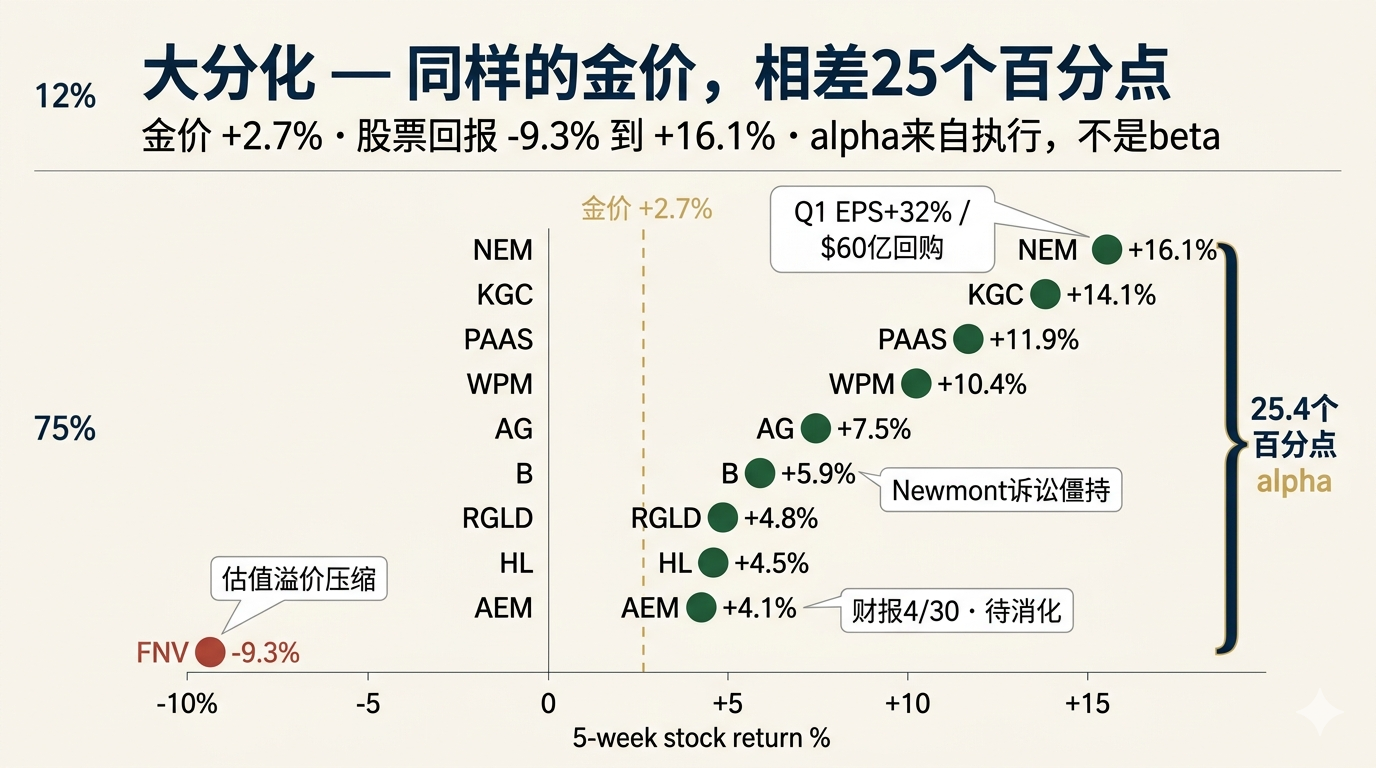
Five weeks delivered a striking phenomenon: all the miners enjoyed the same gold price ($4,520→$4,644) and the same macro environment, and yet returns ranged from −9% to +16%.
| Stock | 5-Week Return | Primary Driver |
|---|---|---|
| NEM | +16.1% | Q1 beat + $6B buyback |
| KGC | +14.1% | Margins +92%, record FCF |
| AEM | +4.1% | Earnings reported 4/30, market hasn’t digested |
| B (formerly GOLD) | +5.9% | Newmont Nevada lawsuit unresolved, spinoff stuck |
| FNV | −9.3% | Valuation premium compressed |
What this tells us: in a sideways gold environment, alpha comes from three things — execution beats (NEM, KGC), credit-quality upgrades (AEM), and reasonable valuation (not FNV). The systematic “buy all gold stocks” trade isn’t going to work in H2 2026; stock selection starts to matter.
For the next leg, B (Barrick) is the name to be most cautious about. Fundamentals aren’t broken, but the Newmont Nevada Gold Mines legal standoff is unresolved, and the planned $60B+ North American spinout IPO is in “strategic paralysis.” New CEO Mark Hill’s May 11 print is the catalyst, but don’t size up before that uncertainty clears.
2.3 The Real Yield Decoupling — Gold’s New Driver
The most under-discussed data point: 10-year TIPS real yield was 1.93% on April 29. That’s a “high real yield” level. Historically that should be a tailwind to sell gold. But gold is at $4,640.
The historical correlation has broken. Gold today is being priced not by real rates, but by three other things: 1. Geopolitical tail risk (Hormuz) 2. Fed credibility / independence (Powell staying on the Board, the Trump-Warsh chatter) 3. Structural central-bank bid
Implication: if the Fed actually cuts in June or July (markets imply ~50% probability), real rates will fall — and at that point the old correlation snaps back temporarily on top of the new drivers — which is the potential trigger for gold’s run at $5,000+/oz. Scenario 4 (new highs) has higher probability today than the 15% the prior article assigned. I’d revise it to 25-30%.
2.4 The M&A Wave — Sector Consolidation
Q1 2026 global mining M&A: $21.6B — the strongest Q1 since 2023. Precious metals is the hottest sub-segment: - Coeur acquired New Gold (March) - Coeur acquired SilverCrest ($1.7B) - PAAS acquired MAG Silver ($2.1B) — PAAS shifted from acquisition target to acquirer
Implication: miners have so much cash they don’t know what to do with it — buying back, paying dividends, and acquiring all at once. Mid-cap silver names with high-grade, low-jurisdictional-risk North/South American assets get a takeout premium. PAAS is the most direct operator of this thesis. HL (Hecla) is a potential takeout candidate — it’s the largest US-domiciled silver producer, and in a world of rising resource nationalism, that’s a scarce asset.
Part 3: The Refreshed Battle Plan
3.1 Rating Changes — vs Prior Article
| Stock | Prior | 5-Wk Return | New Rating | Reasoning |
|---|---|---|---|---|
| NEM | Buy | +16.1% | Core Hold | Q1 beat + $6B buyback; the cleanest expression of the capital-return theme |
| AEM | Buy | +4.1% | Buy (upgrade to “sleep-well core”) | A− credit = highest quality in sector; 4/30 print not yet absorbed |
| KGC | Buy | +14.1% | Hold (already up 14%, careful chasing) | Valuation edge narrowed but fundamentals strong; new positions wait for pullback |
| WPM | Buy | +10.4% | Buy (add priority increased) | 5/7 print is the catalyst; streaming model thrives in sideways gold tape |
| B (formerly GOLD) | Hold | +5.9% | Wait (decide after 5/11 print) | Legal risk + spinoff stuck; new CEO’s guide is the key tell |
| PAAS | Buy | +11.9% | Hold | MAG Silver acquisition adds execution risk; wait for integration visibility |
| FNV | Hold | −9.3% | Hold (target $200 to buy) | Valuation compression continues; DCF fair value far below current; don’t “Add” at $230, wait for $200 |
| RGLD | Hold | +4.8% | Hold | 5/6 print, prior thesis intact |
| AG | Spec Buy | +7.5% | Hold | Silver industrial demand doubt rises; cap position at 3% |
| HL | Spec Hold | +4.5% | Wait (potential takeout) | US jurisdictional premium + plausible major-miner takeout candidate |
3.2 Updated Buy/Add/Trim/Stop
Recalibrated to 4/30 closes:
| Stock | 4/30 Price | Buy | Add | Trim | Stop |
|---|---|---|---|---|---|
| NEM | $111.22 | $100 | $107 | $145 | $85 |
| AEM | $186.42 | $170 | $180 | $230 | $148 |
| KGC | $30.24 | $26 | $29 | $40 | $22 |
| WPM | $127 | $115 | $122 | $158 | $98 |
| B | $39.34 | wait 5/11 | — | $52 | $30 |
| PAAS | $52.29 | $46 | $50 | $66 | $38 |
| FNV | $228.51 | $200 | $210 | $260 | $175 |
| RGLD | $235.80 | $215 | $228 | $270 | $185 |
| AG | $19.64 | $16 | $18 | $26 | $13 |
| HL | $18.02 | $15 | $17 | $26 | $12 |
Note on FNV: do not “Add” at $235. Wait for $200. The prior article’s $235 Add level assumed valuation had finished compressing — April proved that compression is still in progress, and the next entry needs a deeper discount.
3.3 If You Only Do One Thing — NEM
If you’re seeing this article today with no positions, looking to make one trade: Newmont (NEM).
The case: - Q1 just blew the doors off — EPS beat by 32%, record FCF $3.1B - New $6B buyback — at the current share price, this retires roughly 5.5% of float - Largest reserve base in the sector (118.2M oz) supporting 20+ year mine life - Among the cheapest valuations in the sector — forward P/E ~13x even after a 16% rally - Best risk/reward — downside floor near $95 (5-week low), upside trim at $130-145 - No special narrative needed to win — gold simply staying above $4,500 is enough; Hormuz is the optionality
Risk: the unresolved Newmont/Barrick Nevada Gold Mines legal standoff. But this risk is hedged by the $6B buyback and the record FCF.
Second pick: WPM going into the May 7 print. Streaming model holds margins in sideways gold tape, and the print has positive-catalyst potential.
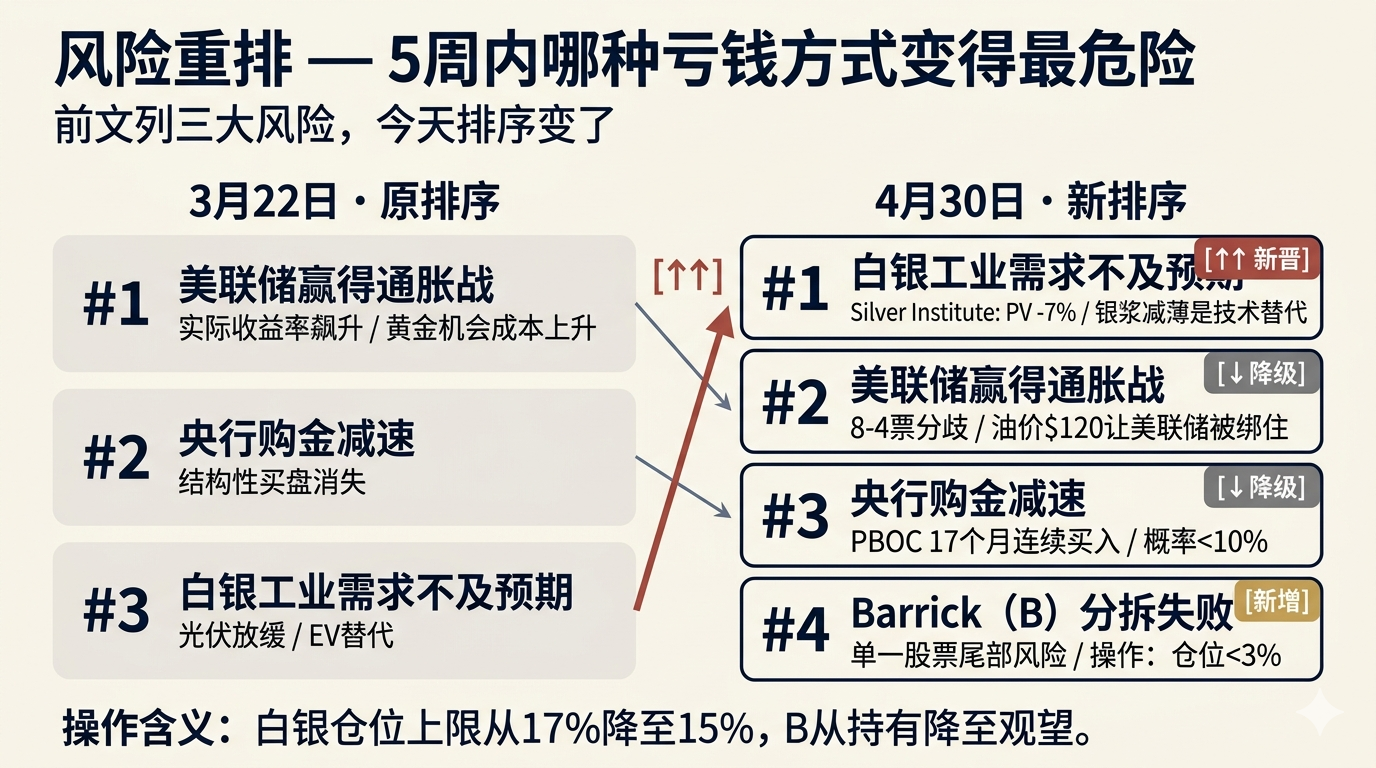
Part 4: Risk Re-Ranking — Which Way To Lose Is Most Dangerous Now
The prior article listed three ways to lose money. Five weeks in, the order has shifted:
Was #1: Fed Wins The Inflation War → Now #2
- Inflation still 3.0-3.2% YoY, but FOMC dissent on 4/29 was 8-4 — most divided since 1992 — with the dovish camp in the minority but the narrative shifting
- With oil at $120, the Fed cannot tighten — it’s pinned, not actively hawkish
- Risk still real, but probability lower over H2 2026
New #1: Silver Industrial Demand Undershoots
- Silver Institute already cut 2026 PV silver demand by 7-19%
- Reason isn’t slowing solar deployment — it’s silver paste thrifting, which is a permanent demand erosion, not a cyclical wobble
- Silver miners (AG, HL, PAAS) face real alpha pressure; gold/silver ratio could expand from 63x to 75x+
- Operational implication: cap silver allocation at 15% of portfolio (prior article said 17%)
Was #2: Central Bank Buying Slows → Now #3
- PBOC 17 months of consecutive buying; March’s +5 tonnes was the largest in over a year
- Zero deceleration signals
- Probability low, <10%
New #4: Barrick (B) Spinoff Fails + Newmont Lawsuit Escalates
- Not a macro risk — single-stock tail risk
- Impact: B could drop 30-40%, but it’s positive for NEM (Newmont wins the suit, accelerates buyback)
- Operational implication: trim B to <3% of portfolio or zero
Part 5: Monitoring Variables Update
| Variable | Current (4/30) | Bull Trigger | Bear Trigger |
|---|---|---|---|
| PBOC monthly gold purchases | 5t/mo (17 mo streak) | >7t/mo | Pause or <2t/mo |
| Federal Funds Rate | 3.50-3.75% (8-4 split) | Cut at 6/17 or 7/29 FOMC | Hold through Q4 2026 |
| 10Y Real Yield (TIPS) | 1.93% | Falls below 1.5% | Spikes above 2.5% |
| GLD ETF Flows | April net inflow | Sustained >$1B/wk inflow | Single week >$2B outflow |
| SLV ETF Flows | −$590M/mo | Turns net positive | Outflows accelerate to −$1B/mo |
| Gold/Silver Ratio | ~63x | Falls below 55x (silver outperforms) | Spikes above 75x (industrial distress) |
| Brent Crude | $121.90 | Normalizes to $85-95 | Sustained above $130 (recession panic) |
| Hormuz Throughput | ~5% of pre-war | Recovers to 50%+ | Total closure + military expansion |
| PV Silver Paste Demand | 2026 cut −7% | Cut reverses or installations accelerate | Further cut to −15%+ |
| Barrick 5/11 Print | Pending | Spinoff back on track + lawsuit settlement | Spinoff abandoned or escalation |
| Remaining May Earnings | WPM/RGLD/PAAS/AG/HL/FNV/B | All beat + buyback expansion | Any major-miner guide-down |
Closing: The Framework Held, The Story Changed
Five weeks ago the conclusion was: “This isn’t a trade. It’s a regime change in global reserve management.”
Five weeks later that judgment still stands — but the protagonist of the story has changed.
Story #1 was “geopolitics + central-bank de-dollarization driving gold.” That story is still playing, but it’s now well-priced.
Story #2 is taking the stage: miners have so much cash it’s overflowing, and they’ve started returning it. Newmont’s $6B buyback. Agnico’s credit upgrade. Kinross margins +92%. PAAS using cash for M&A. Sector M&A of $21.6B in Q1 — these aren’t isolated events. They’re the same thing: the precious-metals sector is morphing from a cyclical cash machine into a structural capital-return machine.
This shift will play out across multiple quarters, not weeks. It means: - Quality premium expands — AEM’s A− credit, NEM’s buyback scale, WPM’s zero debt — these “boring metrics” get repriced - Multiple-compression risk falls — the floor that buybacks build is real; FNV dropped 9% rather than 20% as evidence - Stock selection becomes more important — in sideways gold tape, alpha comes from execution, not beta
Story #3 is the warning: silver industrial demand has a real crack. PV thrifting isn’t a cyclical issue, it’s a technological substitution. It doesn’t kill the silver thesis (the deficit is intact, AI demand is real), but it lowers silver’s expected outperformance vs gold. The gold/silver ratio probably ranges 63-75 for longer, not back below 55.
On positioning: hold core, wait for deeper pullbacks to add. Highest-conviction single name: NEM. Most cautious single name: B. Most under-priced May catalyst: WPM earnings.
“Geopolitical Edge” Series, Part 3 · Follow-up. Prior installments: Part 3 · Original | Part 3 · Bottom Analysis
Disclaimer: This analysis is for research and educational purposes only and does not constitute investment advice. Data as of April 30, 2026. Gold ~$4,644/oz, silver ~$73.65/oz. Fundamental data sourced from Q1 2026 company earnings releases, Stockanalysis, Yahoo Finance, FRED, World Gold Council, Silver Institute, and Reuters.