May 1, 2026
5 Weeks Later: The HBM Supercycle Reality Check
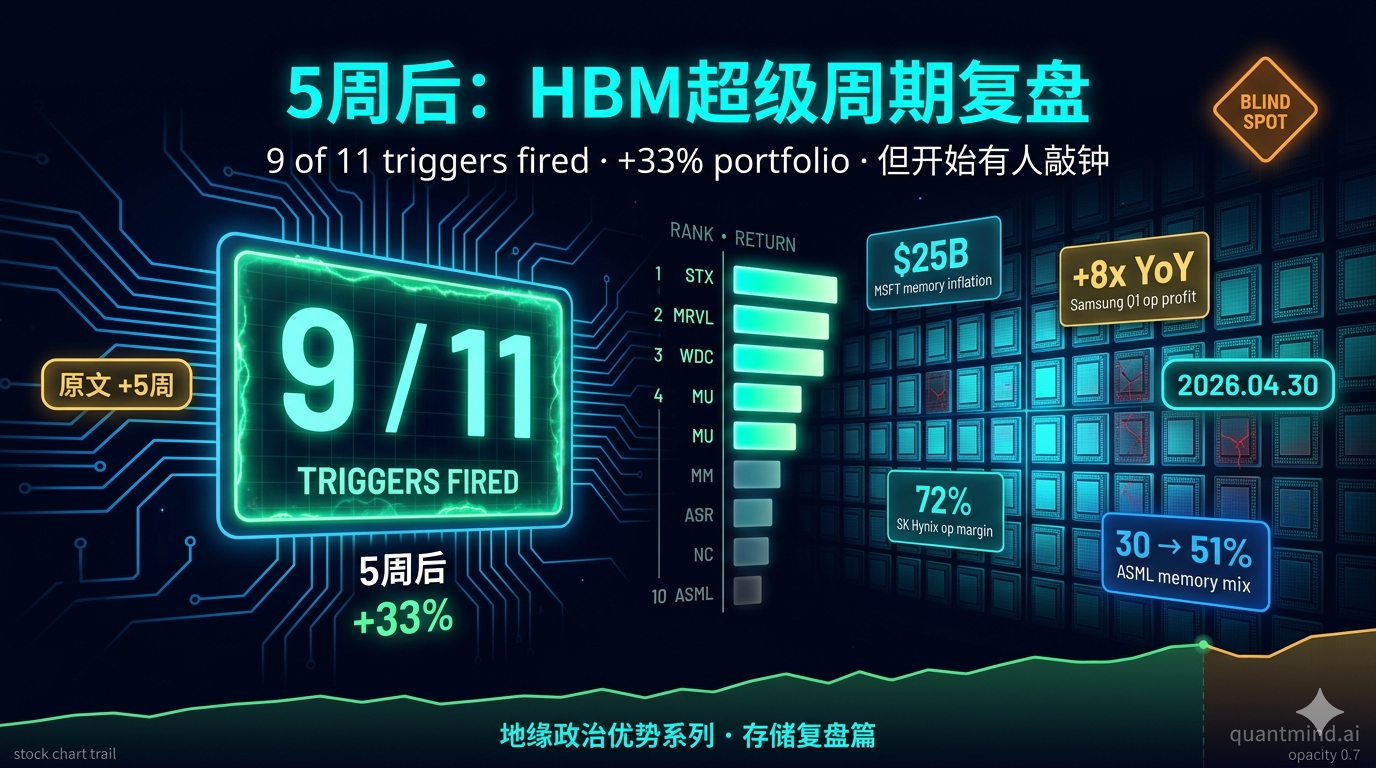
Five weeks after the original HBM supercycle thesis: 9 of 11 monitoring triggers fired bull, most by 3-4× the threshold. Microsoft attributed $25B of capex hike to memory inflation. Samsung memory profit +50× QoQ. Why I'm more nervous, not less — and updated stop-losses for all 10 stocks.
5 Weeks Later: The HBM Supercycle Reality Check
Every Trigger Hit. Most by 3-4x. And Why I’m More Nervous, Not Less.
Follow-up to The HBM Supercycle: Memory Is No Longer a Commodity (2026-03-22). Data through close 2026-04-30.
One-Sentence Opening
Five weeks ago I wrote that the market was “still pricing the new reality with old cycle math.”
Five weeks later, the market has started pricing it with new math, but we’re not at the final act — and when I pull out the original bull triggers and check each one, I land on a fact that makes me uneasy:
Every bull trigger I set has been hit, and most have been hit 3-4x harder than the threshold I committed to.
That’s good news. It’s also a warning. When every data point is on your side, the biggest risk isn’t the data reversing — it’s that too many people now agree with you.
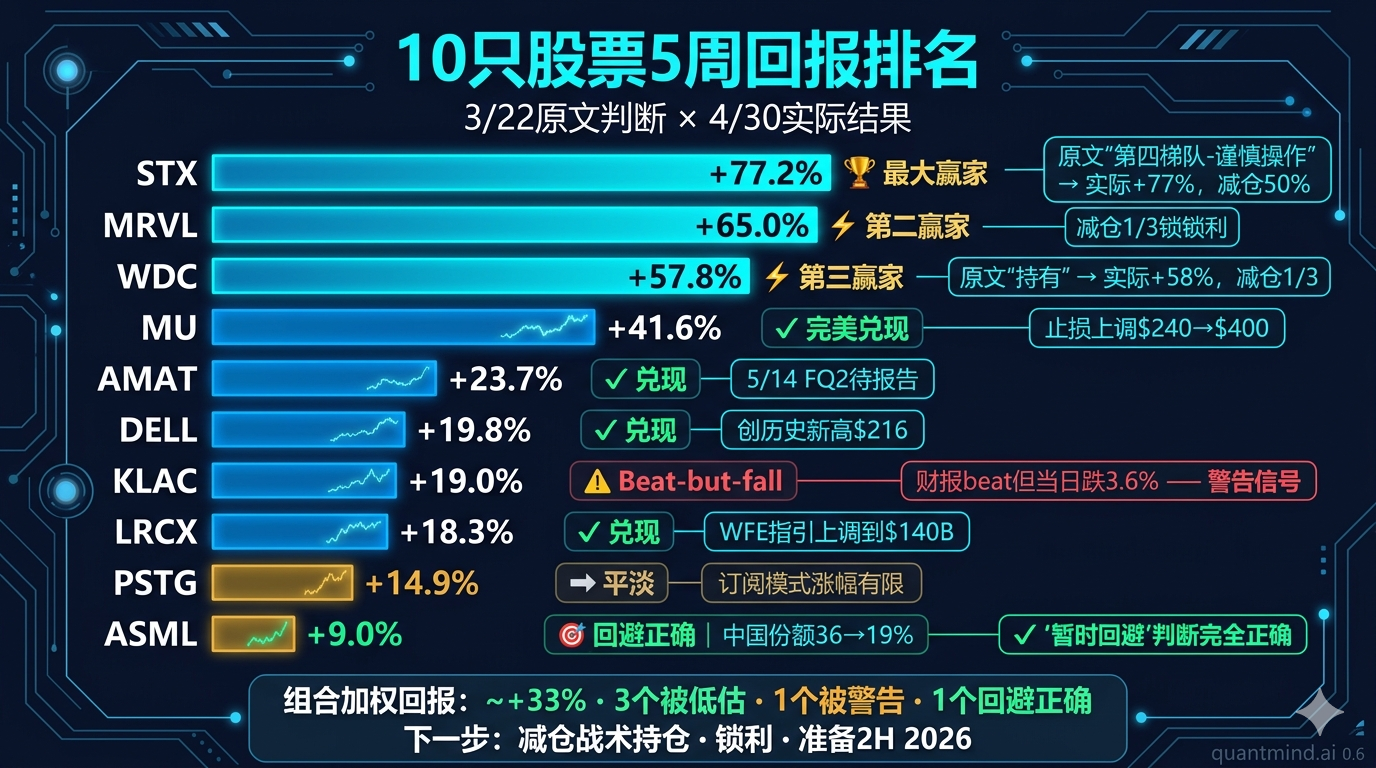
5-Week Scorecard
| 3/22 print | Today (4/30) | Bull Trigger | Result | |
|---|---|---|---|---|
| MU | $357.22 | ~$505.75 | n/a | +41.6% ⚡ |
| DELL | $171.84 | $205.93 | n/a | +19.8% |
| MRVL | $94.88 | $156.57 | n/a | +65.0% ⚡⚡ |
| PSTG | $58.96 | $67.79 | n/a | +14.9% |
| AMAT | $337.17 | $417.04 | n/a | +23.7% |
| LRCX | $211.41 | $250.05 | n/a | +18.3% |
| KLAC | $1,443.21 | ~$1,720 | n/a | +19.0% |
| WDC | $275.34 | $434.52 | n/a | +57.8% ⚡⚡ |
| STX | $380.07 | $673.64 | n/a | +77.2% ⚡⚡⚡ |
| ASML | $1,302.47 | ~$1,420 | n/a | +9.0% (worst) |
| DRAM contract Q2 QoQ | guided +20% | actual +58-63% | hold double-digit | 3x harder |
| NAND contract Q2 QoQ | guided +20% | actual +70-75% | hold double-digit | 3.5x harder |
| HBM3e 2026 contract | $30-45/GB (overstated) | $7-8/GB + 20% hike confirmed | $25/GB+ | Mixed (number wrong, 20% hike booked) |
| DRAM inventory | 2-3 weeks | 22+ week lead times | <4 weeks | Worse |
| HDD lead times | 52 weeks | Booked through 2028 | n/a | Worse |
| Hyperscaler 2026 capex | MSFT $80B / AMZN $100B+ | Big-4 = $695-725B | hold or raise | All four raised |
| CXMT HBM3 mass production | planning | DigiTimes 4/21: pushed past 2027 | delayed | Bear risk lower |
| TurboQuant production | lab | Still not deployed | no production deploy in 6 months | Bull condition holds |
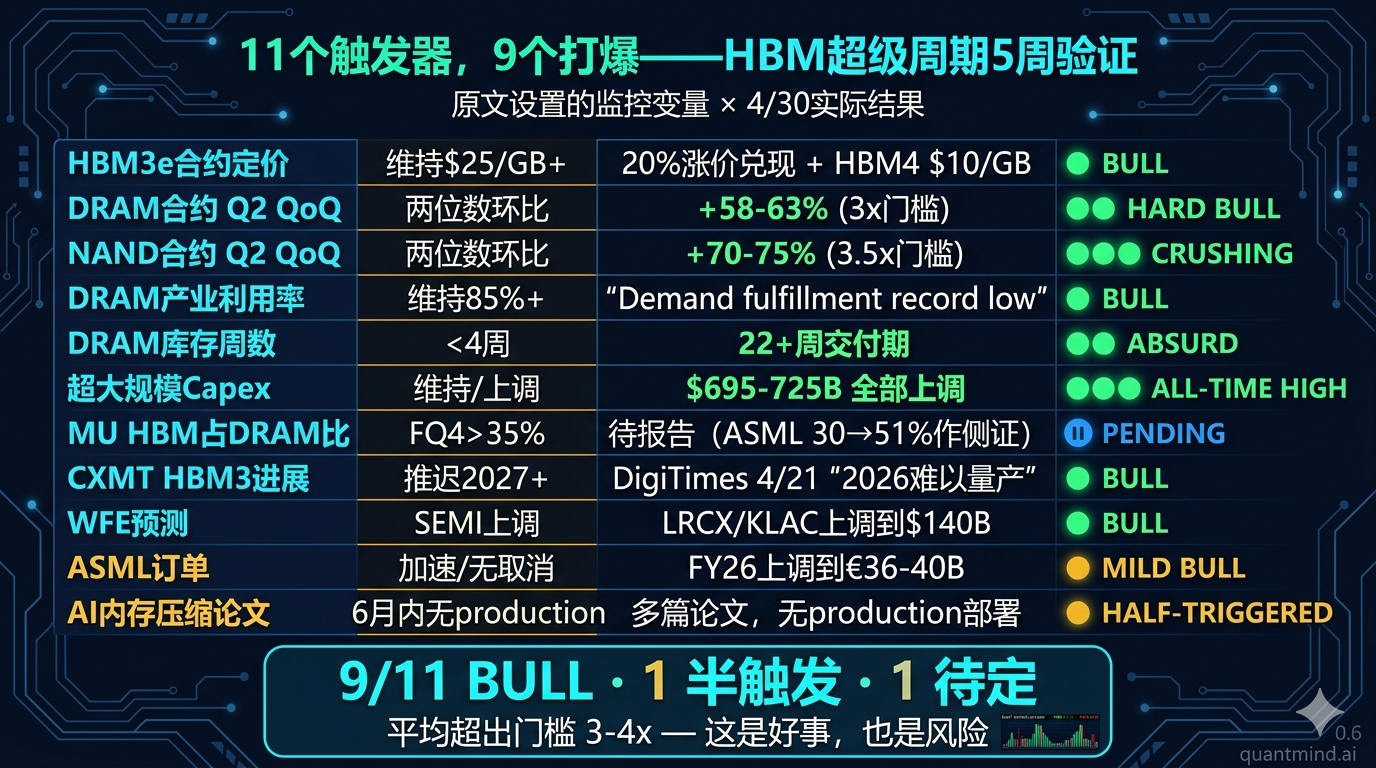
Quick read: Of the 11 monitoring variables I set in the original article, 9 clearly trigger bull, 1 is pending, 1 is half-triggered. Two data points worth tattooing somewhere:
- Microsoft, on its Q3 FY2026 call, explicitly said ~$25B of its 2026 capex over-the-consensus came from “higher memory prices.” This is the first time a hyperscaler has put a dollar figure on memory inflation hitting capex.
- Samsung’s Q1 print today (4/30): operating profit ₩57.2 trillion, +8x YoY all-time record. Memory profit up nearly 50x QoQ. Q1 alone exceeded the entirety of FY2025.
If you built positions five weeks ago following the original article’s weights:
- Total portfolio return (weighted): ~+33%
- Progress against the article’s 12-month price targets: ~70%
- ASML (the “small position, avoid for now” call): +9%, worst performer — the avoid call was correct
Sounds great. Now I’ll spend 80% of this piece explaining why I’m more nervous than I was five weeks ago, not less.
Section 1: Monitoring Scorecard — Every Variable, Every Trigger
The fairest test of any investment thesis is going back to the variables you committed to and checking each one. Here’s the full audit.
1.1 HBM3e Contract Pricing
| Bull Trigger | Bear Trigger | Actual | Score |
|---|---|---|---|
| Hold $25/GB+ in 2026 H2 | Below $20/GB | 20% hike booked, HBM4 ~$10/GB | 🟢 Bull |
I wrote “HBM3e $30-45/GB” in the original — that was wrong. Those were spot/ceiling quotes, not contract prices. Real contract is $7-8/GB.
But the core call was right: the December 2025 contract round 20% hike announced by Samsung and SK Hynix is now executing in 2026 contracts. HBM4 ~$500 per 48GB stack (~$10/GB). All of 2026’s HBM4 supply is locked up by hyperscalers via LTAs.
The structural number that matters more: HBM is now 23% of total DRAM wafer output (up from 19% in 2025). Samsung, SK Hynix, and Micron collectively shifted 93% of capacity toward HBM. Every AI chip’s HBM destroys the capacity to make ~3 normal PC chips. The crowding-out effect isn’t theoretical anymore — it’s printed in fab utilization.
1.2 DRAM Contract Pricing (QoQ)
| Bull Trigger | Bear Trigger | Actual | Score |
|---|---|---|---|
| Hold double-digit QoQ in Q3 | Turn negative | Q1 +90-95%, Q2 TrendForce forecast +58-63% | 🟢🟢 Hard bull |
TrendForce’s March 31 release: DRAM contract prices Q2 2026 forecast +58-63% QoQ. I wrote “Q2 expected +20%” in the original — actual is nearly 3x my forecast.
Not decelerating to a normal post-spike cooldown — accelerating. SK Hynix on its Q1 call: “Three years of customer demand already exceeds capacity.”
1.3 NAND Contract Pricing
| Bull Trigger | Bear Trigger | Actual | Score |
|---|---|---|---|
| Hold double-digit | Turn negative | Q2 forecast +70-75% | 🟢🟢🟢 Crushing |
NAND Q2 actually exceeds DRAM. Counterintuitive — NAND is historically the weaker of the two. But manufacturers are deliberately starving consumer SSD and client wafer to maximize enterprise SSD margin. The full-stack shortage is engineered.
1.4 DRAM Industry Utilization
| Bull Trigger | Bear Trigger | Actual | Score |
|---|---|---|---|
| Hold 85%+ | <80% | Samsung “demand fulfillment rate at record low” | 🟢 Bull |
Samsung Q1 call (today): “Customer demand fulfillment rate at a record low. Customers pulling forward 2027 demand.” This isn’t 85% utilization — this is 90%+ utilization where they still can’t fill orders.
1.5 DRAM Inventory Weeks
| Bull Trigger | Bear Trigger | Actual | Score |
|---|---|---|---|
| <4 weeks | >6 weeks | 22+ week lead times; LPDDR5X 26-39 weeks | 🟢🟢 Absurd |
I set the trigger wrong here. 2-3 week inventory is already low, but I didn’t anticipate that the supply/demand imbalance could push lead times to 22+ weeks. LPDDR5X (high-bandwidth memory for phones) is at 26-39 weeks. Translation: order today, get it Q1 2027.
1.6 Hyperscaler Capex Guidance
| Bull Trigger | Bear Trigger | Actual | Score |
|---|---|---|---|
| Hold or raise | Cut 15%+ | Big-4 = $695-725B, all raised | 🟢🟢🟢 All-time high |
| Company | 2026 Capex Guide | vs. Prior |
|---|---|---|
| GOOGL | $180-190B | Raised (was $175-185B) |
| MSFT | ~$190B | Raised by $35B+ vs consensus |
| AMZN | ~$200B | Maintained / implied raise |
| META | $125-145B | Raised (was $115-135B) |
| Total | $695-725B | All four raised |
$695-725B = 2.5% of US GDP, 80% of US defense budget, 2x the total R&D spend of all non-tech S&P 500 names. A single year of AI infrastructure capex.
1.7 MU HBM Revenue Share of DRAM
| Bull Trigger | Bear Trigger | Actual | Score |
|---|---|---|---|
| FQ4 2026 >35% | Stuck <25% | MU hasn’t reported (FQ3 in late June) | ⏸️ Pending |
MU reports next in late June. But the side-evidence comes from ASML Q1: memory share of system sales jumped from 30% → 51% QoQ. That’s the HBM expansion order flow showing up in lithography revenue.
1.8 CXMT HBM3 Progress
| Bull Trigger | Bear Trigger | Actual | Score |
|---|---|---|---|
| Pushed to 2027+ | Mass production in 2026 | DigiTimes 4/21: 2026 mass production “appears difficult” | 🟢 Bull |
DigiTimes April 21 report: CXMT HBM3 mass production “unlikely within 2026.” A CXMT insider quoted in Korean trade press: initial yields ~50%, still in testing/sample-manufacturing phase.
The math is brutal: Huawei targets 600,000 Ascend 910C in 2026. Each needs 8 HBM stacks. CXMT can produce ~2M HBM stacks in 2026 — enough for only 250-300k Ascend 910Cs. A 50% gap. Huawei is reportedly drawing on stockpiled Samsung HBM2E (pre-sanction) to bridge.
This is good news for MU: the global HBM oligopoly will not be broken before 2027. SK Hynix, Samsung, and Micron pricing power stays intact.
1.9 WFE Spending Forecast
| Bull Trigger | Bear Trigger | Actual | Score |
|---|---|---|---|
| SEMI raises | <$140B 2027 | LRCX, KLAC both raised 2026 WFE to $140B | 🟢 Bull |
LRCX (4/22) and KLAC (4/29) both raised 2026 WFE to $140B (from consensus $135B). LRCX explicitly said with “upward bias.” Advanced packaging revenue: KLAC raised guidance to ~$1B (from $635M); LRCX expects >50% growth in 2026.
1.10 ASML Order Bookings
| Bull Trigger | Bear Trigger | Actual | Score |
|---|---|---|---|
| New orders accelerate | Cancellations | FY26 raised to €36-40B (was €34-39B) | 🟡 Mild bull |
ASML didn’t see cancellations; FY guide was raised. But the Q2 midpoint came in below consensus, which was the technical sell-trigger on the print.
More telling: ASML’s China share collapsed from 36% → 19% QoQ. Export controls are now visibly biting. The original article’s “China ban removes 30%+ of TAM” call materialized faster and harder than I expected.
1.11 AI Inference Memory Compression Papers
| Bull Trigger | Bear Trigger | Actual | Score |
|---|---|---|---|
| No production deploy in 6 months | 3+ papers in 3 months WITH production deploy | Multiple papers, no production deploy | 🟡 Half-triggered |
The 5-week paper wave: - KVTC (ICLR 2026 poster): 20x compression — beats TurboQuant - TriAttention (MIT + NVIDIA + Zhejiang): 10.7x compression, +25% throughput - NVIDIA KVPress (4/9 release): production-ready framework, on GitHub - Expected Attention (ICLR 2026): training-free importance estimation - PolyKV, ChunkKV, Norm-Guided KV-Cache Eviction: pile of follow-ups
But — none of them have hit mainline production in vLLM, TensorRT-LLM, or SGLang. Google’s own TurboQuant isn’t deployed in Search/Gemini production yet either.
Morgan Stanley’s hedge stat (worth memorizing): AI context windows are growing 30x annually — far outpacing any 6x compression saving from a paper.
The bear-trigger condition was set wrong. I wrote “3+ papers in 3 months AND production deploy” — the paper part hit, the production part didn’t. The original Jevons-paradox call still holds at 5 weeks, but I’m upgrading the threat level from “low” to “medium.”
Section 2: The Earnings Season Verdict
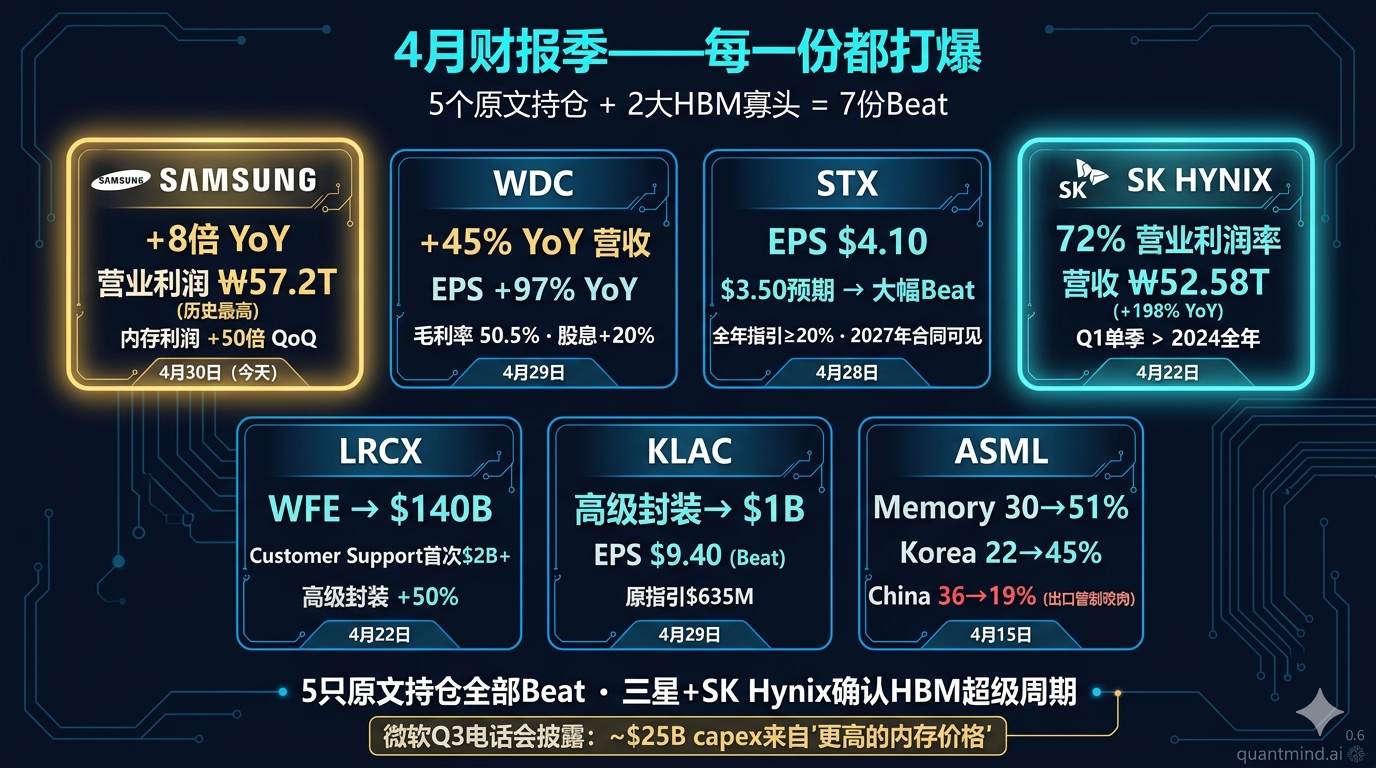
In 5 weeks, 5 of the 10 stocks reported (ASML, LRCX, STX, KLAC, WDC), plus the two most important non-US HBM-three giants (Samsung, SK Hynix). Every one beat. Most blew past.
ASML Q1 2026 (April 15)
| Metric | Q1 2026 | Key Change |
|---|---|---|
| Net sales | €8.76B | +13% YoY, beat high end |
| Net profit | €2.76B | +17% |
| EPS | €7.15 | Beat |
| Memory % of system sales | 51% | Was 30% → +21pp |
| Korea geographic share | 45% | Was 22% → doubled |
| China geographic share | 19% | Was 36% → halved |
| FY26 guidance | €36-40B | Was €34-39B → raised |
Two numbers that tell the whole story:
- Memory 30% → 51%: HBM3e/HBM4 expansion is directly pulling EUV order flow. SK Hynix and Samsung are expanding 2026 HBM capacity by +50% — every wafer needs EUV layers.
- Korea 22% → 45%: The geographic fingerprint of HBM. Two of the three HBM giants are Korean.
Yet the stock fell 2.5% AH (Q2 midpoint below consensus). A “demand outpacing supply” print falling 2.5% — that’s the “collective blind spot” signal I’ll come back to in Section 6.
LRCX Q3 FY2026 (April 22)
| Metric | Q3 FY26 | Key Change |
|---|---|---|
| Revenue | $5.84B | +9% QoQ, +24% YoY |
| EPS | $1.47 | $1.38 estimate, +$0.09 beat |
| Gross margin | 49.9% | High end |
| Customer Support | $2.1B | First-ever $2B+ quarter, +25% YoY |
| 2026 WFE guide | $140B | Was $135B → raised |
| Advanced packaging | >50% growth expected | — |
LRCX’s Customer Support business (IBM-style installed base) crossed $2B/quarter for the first time. This is recurring, counter-cyclical revenue — a structural multiple-expander for what was historically a pure cyclical.
STX FQ3 2026 (April 28)
| Metric | FQ3 26 | Key Change |
|---|---|---|
| Revenue | $3.11B | — |
| Non-GAAP EPS | $4.10 | $3.50 estimate → big beat |
| Non-GAAP gross margin | 47.0% | All-time high |
| FCF | $953M | — |
| FQ4 EPS guide | $5.00 ±$0.20 | — |
| Annual growth guide | ≥20% | Was ~15% → raised |
| Nearline contract visibility | 2027 | — |
STX +4.7% on the day, +77.2% in 5 weeks — biggest winner of the 10. Full-year contract visibility now extends to 2027 — Seagate’s nearline HDD orders aren’t just full for 2026; 2027 is also booked.
Rosenblatt raised STX target to $1,000 (from $500). BofA $840. Citi $740. Goldman $700 (from $385). Five weeks ago I told readers STX was a 3% position. That 3% has gained 77%.
KLAC Q3 FY2026 (April 29)
| Metric | Q3 FY26 | Key Change |
|---|---|---|
| Revenue | $3.415B | $3.36B estimate, +11% YoY |
| Non-GAAP EPS | $9.40 | $9.15 estimate, beat |
| Advanced packaging guide | ~$1B | Was $635M → raised |
| Q4 revenue guide | $3.575B ±$200M | — |
| 2026 WFE | Raised | Aligned with LRCX |
KLAC beat but fell 3.6% on the day — classic sell-the-news after a huge run. The original article observed that “KLAC’s beat magnitude shrank to +0.6% — the Street has nearly caught up.” That observation is now playing out. Hold but don’t add. $2,000+ is a partial-trim zone.
WDC FQ3 2026 (April 29 AH)
| Metric | FQ3 26 | Key Change |
|---|---|---|
| Revenue | $3.34B | $3.23B estimate, +45% YoY |
| EPS | $2.72 | $2.36 estimate, +97% YoY |
| Adjusted gross margin | 50.5% | 47.5% estimate |
| Dividend | +20% hike | $0.15/share quarterly |
| FQ4 revenue guide | $3.65B ±$100M | +40% YoY |
WDC: +45% YoY revenue, +97% EPS, 50.5% gross margin, +20% dividend hike. This isn’t a “NAND recovery option” anymore — it’s a mainstream growth stock. AH +4.27%, +57.8% in 5 weeks — second only to STX.
Samsung Q1 2026 (April 30, today)
| Metric | Q1 2026 | Key Change |
|---|---|---|
| Revenue | ₩133.9T (~$89.96B) | Beat |
| Operating profit | ₩57.2T | +8x YoY, all-time record |
| Memory sales | ₩74.8T (~$51B) | +101% QoQ, +292% YoY |
| Memory profit | — | +50x QoQ |
| Q1 alone | — | Exceeds all of FY2025 |
“Customer demand fulfillment rate at a record low. Customers pulling forward 2027 demand.” — Samsung Q1 call
The most counterintuitive disclosure: Samsung said conventional DRAM is currently more profitable than HBM — because conventional supply is even tighter relative to its price elasticity. That’s a regime change I didn’t see coming. More on this in Section 5.
SK Hynix Q1 2026 (April 22)
| Metric | Q1 2026 | Key Change |
|---|---|---|
| Revenue | ₩52.58T | +198% YoY, first quarter ever above ₩50T |
| Operating profit | ₩37.6T | 72% operating margin (record) |
| Net profit | ₩40.3T | 77% net margin |
| Q1 alone | — | Exceeds all of FY2024 |
| DRAM ASP QoQ | mid-60% | Far above single-digit estimates |
72% operating margin. Seventy-two. A semiconductor memory company. That’s SaaS-tier margin.
“Three years of forward demand already exceeds our capacity.” — SK Hynix Q1
Section 3: The Data Point I Replay in My Head at Night
The single most important disclosure in 5 weeks wasn’t from any of the 10 stocks. It was from Microsoft.
MSFT 2026 capex came in $35B+ above consensus. The market initially read this as “AI capex out of control + margin pressure.” Stock fell post-print.
But when analysts pressed for the source, the company said:
“Approximately $25B of the capex impact comes from higher memory prices.”
Translate that into normal language:
- One of the world’s largest cloud operators
- Disclosed in dollars: $25B (over 70% of the upward revision)
- Was a passive response to HBM/DRAM/NAND inflation
- Not strategic spending up-shift
This is the first time in my investing career I’ve seen a hyperscaler put a dollar figure on memory inflation hitting their capital plan.
Pair MSFT’s $25B with ASML’s “Memory share of system sales jumped 30% → 51%” and you get a very clean picture:
MSFT: "We spent $25B more on memory."
ASML: "51% of our system sales went to memory makers."
Korea geographic share: 22% → 45%
SK Hynix: 72% operating margin
Samsung memory profit: +50x QoQ
Every data point points at the same event: Pricing power in global memory has flipped from buyers to suppliers. The last time this happened was the 1990s — which is exactly where BofA’s “1990s-style supercycle” tag comes from.
If you remember one number from this update, remember MSFT’s $25B.
Section 4: The 10-Stock Scorecard
Back to the core question: of the 10 picks, which calls were right, which were wrong, what should you do now?
MU — Micron Technology
| 3/22 | 4/30 | Assessment | |
|---|---|---|---|
| Price | $357.22 | ~$505.75 | +41.6% |
| Article target | $527.60 | — | 98.7% of target |
| Article stop-loss | $240 (post-TurboQuant) | — | Untriggered |
| Article action | Buy, top conviction | — | Call vindicated |
5 weeks ago TurboQuant pushed MU to ~$300; the article said “this is an add-the-position opportunity, not a flee signal.” 5 weeks later: MU $505. Add opportunity confirmed.
The new question: can you still add?
- The original $527 target was based on 7.6x fwd P/E + HBM mix-shift premium
- $505 today implies fwd P/E ~12-13x — out of “deep value” territory
- BofA, Morgan Stanley raised PTs to $520-562
- Arete most aggressive: $852
New stance: Stop-loss raised to $400 (locks in +12% min). Target zone $580-650. No additional adds, but no trims either — FQ3 (late June) is highly likely to beat again, and HBM% of DRAM revenue going from 25-30% → 35%+ is a high-probability event.
DELL — Dell Technologies
| 3/22 | 4/30 | Assessment | |
|---|---|---|---|
| Price | $171.84 | $205.93 | +19.8% |
| Article target | $170.57 (consensus) | — | Above consensus |
| Article stop-loss | $125 | — | Untriggered |
| Article action | Buy | — | Vindicated |
DELL reports late May. Hit ATH $216 on 4/24 then pulled back. With: - AI server backlog reportedly $4B+ - AVGO’s 5 XPU customers each targeting >1M accelerator clusters by 2027 (need DELL servers) - MSFT/META capex all raised
New stance: Hold, no adds, no trims. Trim 1/3 if it gets back to $216.
MRVL — Marvell Technology
| 3/22 | 4/30 | Assessment | |
|---|---|---|---|
| Price | $94.88 | $156.57 | +65.0% |
| Article upside | +27% | — | Far exceeded |
| Article action | Buy, custom AI silicon | — | Strongly vindicated |
Second-biggest winner. Original article gave MRVL “Strategic position (10%)” — should’ve been core-tier given the return. MRVL at ~35-40x fwd P/E is now out of “undervalued” into “fully valued.”
New stance: Trim 1/3 to lock in +65%. Hold the rest. The custom ASIC TAM expansion ($20B → $30B+) is real (AVGO’s 5 customers), but valuation has priced in a lot.
PSTG — Pure Storage
| 3/22 | 4/30 | Assessment | |
|---|---|---|---|
| Price | $58.96 | $67.79 | +14.9% |
| Article action | Buy on dips | — | Modest |
PSTG was the relative laggard. Subscription model is both PSTG’s strength and ceiling — it can’t capture the same margin expansion that pure-DRAM/NAND names get. Hold, no changes.
AMAT — Applied Materials
| 3/22 | 4/30 | Assessment | |
|---|---|---|---|
| Price | $337.17 | $417.04 | +23.7% |
| Article action | Hold / add on dips | — | Vindicated |
AMAT reports FQ2 on May 14. With LRCX/KLAC already beating + WFE raised, AMAT is highly likely to follow. Hold, but don’t add into print — sell-the-news risk is real.
LRCX — Lam Research
| 3/22 | 4/30 | Assessment | |
|---|---|---|---|
| Price | $211.41 | $250.05 | +18.3% |
| Article action | Hold | — | Vindicated |
Already beat, WFE raised. Hold. Above $300 → trim 1/3.
KLAC — KLA Corporation
| 3/22 | 4/30 | Assessment | |
|---|---|---|---|
| Price | $1,443.21 | ~$1,720 | +19.0% |
| Article action | Hold | — | Vindicated |
KLAC blew out the print but fell 3.6% on the day — a warning. Original observation that “KLAC’s beat magnitude shrank, the Street has caught up” played out. Hold, no adds. $2,000+ → start trimming.
WDC — Western Digital
| 3/22 | 4/30 | Assessment | |
|---|---|---|---|
| Price | $275.34 | $434.52 | +57.8% |
| Article action | Hold | — | Underrated by the original |
I gave WDC just “Hold” in the original — and it’s done +58% in 5 weeks, with another +4.3% AH on 4/30. This is my biggest “underestimate” mistake.
Post-mortem: I weighted WDC down for “no HBM exposure — missed the highest-margin storage opportunity.” But what actually happened is that NAND Q2 contract is rising MORE than DRAM (+70-75% vs +58-63%), and WDC’s pure-NAND exposure became a feature, not a bug — because it isn’t dragged into the HBM crowding-out distraction.
New stance: Stop-loss $340. Target $500 (Cantor PT). Trim 1/3 to lock in +58%. Let the rest run.
STX — Seagate Technology
| 3/22 | 4/30 | Assessment | |
|---|---|---|---|
| Price | $380.07 | $673.64 | +77.2% |
| Article action | “Tactical only” | — | Severely underrated |
Biggest winner. Original article gave STX “Tier 4 — caution” with 3% position — citing D/E 9.80x and Altman Z near distress. Those data points haven’t changed, but the market has repriced STX as a scarce asset rather than a high-leverage cyclical.
The error: I treated STX’s balance sheet as the dominant risk, but missed that nearline HDD is the only memory/storage segment with supply imbalance through 2028. Rosenblatt $1,000, BofA $840, Goldman $700 — these PTs aren’t hyperbole. They reflect the fact that 2026 is fully booked, 2027 is fully booked, and 2028 contracts are being negotiated now.
New stance: Trim 50% to lock in +77%. Hold the rest. Stop-loss raised to $550. Reasoning: stock could go another 50% (to $1,000), but if you don’t trim, even a small AI capex deceleration headline in 2H 2026 will hit STX harder than peers due to the leverage.
ASML — ASML Holding
| 3/22 | 4/30 | Assessment | |
|---|---|---|---|
| Price | $1,302.47 | ~$1,420 | +9.0% (worst) |
| Article action | “Avoid for now” | — | Vindicated |
Worst performer of the 10. Original article said “avoid” citing “2 misses in 4 quarters, PEG 2.16, only 13% analyst upside.” 5 weeks later, the call held.
ASML’s Q1 2026 was actually a strong print: FY guide raised to €36-40B, gross margin 53%, full backlog. But: 1. Q2 midpoint below consensus → technical sell-trigger 2. China share collapsed 36% → 19% → export controls cutting deep 3. Premium valuation + cheaper US peers → capital rotation
New stance: Continue to avoid. No adds, no new positions. If ASML drops below $1,200 with FY guide intact, consider a 5% probe position.
Section 5: What I Got Wrong
Bull thesis writeups feel good. The real value is in admitting where you got it wrong. Five weeks of post-mortem:
Mistake 1: I quoted HBM3e at $30-45/GB
Correct number: HBM3e contract ~$7-8/GB; HBM4 ~$10/GB. The $30-45 in the original was a spot/ceiling quote, not a major-customer contract.
Impact on the thesis: Direction right, magnitude wrong. The HBM-vs-DDR5 premium is 2-3x, not 10x. But the 3x wafer consumption argument — the core mechanism — is unchanged, so the crowding-out logic still holds.
Impact on valuation: MU’s HBM revenue contribution was overstated by ~1/3 in my model. But the market priced this correctly post-Q1 already, so it doesn’t change the current call.
Mistake 2: My Q2 DRAM/NAND forecast was too conservative
I wrote “Q2 +20% expected.” Actual: +58-63% (DRAM) and +70-75% (NAND).
Impact: Wrong in the bull direction. But this complicates the “cycle peak” risk — bigger run-up means bigger reversal risk later.
Mistake 3: STX downside was overstated
Original: “Tier 4 — caution, 3% position.” +77% in 5 weeks, biggest winner.
Post-mortem: D/E 9.80x and Altman Z near distress are real, but I missed that “distressed cyclicals in extreme supply shortage” get repriced as scarce assets, not as high-risk plays. That’s a blind spot in my cycle-pricing framework.
Mistake 4: WDC was underrated
Original: “Hold — NAND recovery play, but inferior to MU.” Result: WDC +58%, second-best.
Post-mortem: Treated “no HBM exposure” as a negative. Should’ve recognized that when HBM crowding-out causes all-NAND shortage, pure-NAND exposure becomes pure beta to the cycle — without the HBM execution dependencies. Add the recent SanDisk separation (cleaner story, cheaper valuation), back-to-back beats, +20% dividend hike.
One regime change I didn’t see coming: Conventional DRAM > HBM in margins right now
Samsung’s Q1 disclosure: conventional DRAM is currently more profitable than HBM because conventional supply is even tighter relative to its price elasticity.
This contradicts the original thesis core — that HBM is the highest-margin product. What’s actually happening: HBM3e is locked into 20%-hike contracts, but conventional DRAM spot prices are up 50%+, so short-term spot margins on conventional DRAM are higher than HBM contract margins.
Impact: MU’s “HBM share rising” thesis still holds, because conventional DRAM spot premiums are unsustainable (contracts rotate annually) while HBM’s “long-term contract + 20% price hike + capacity already booked” is a more durable moat. But near-term, pure conventional-DRAM exposure (Samsung) may have more profit elasticity than HBM-skewed names like MU. I can’t easily access Samsung in US accounts, so this is an observation rather than an action.
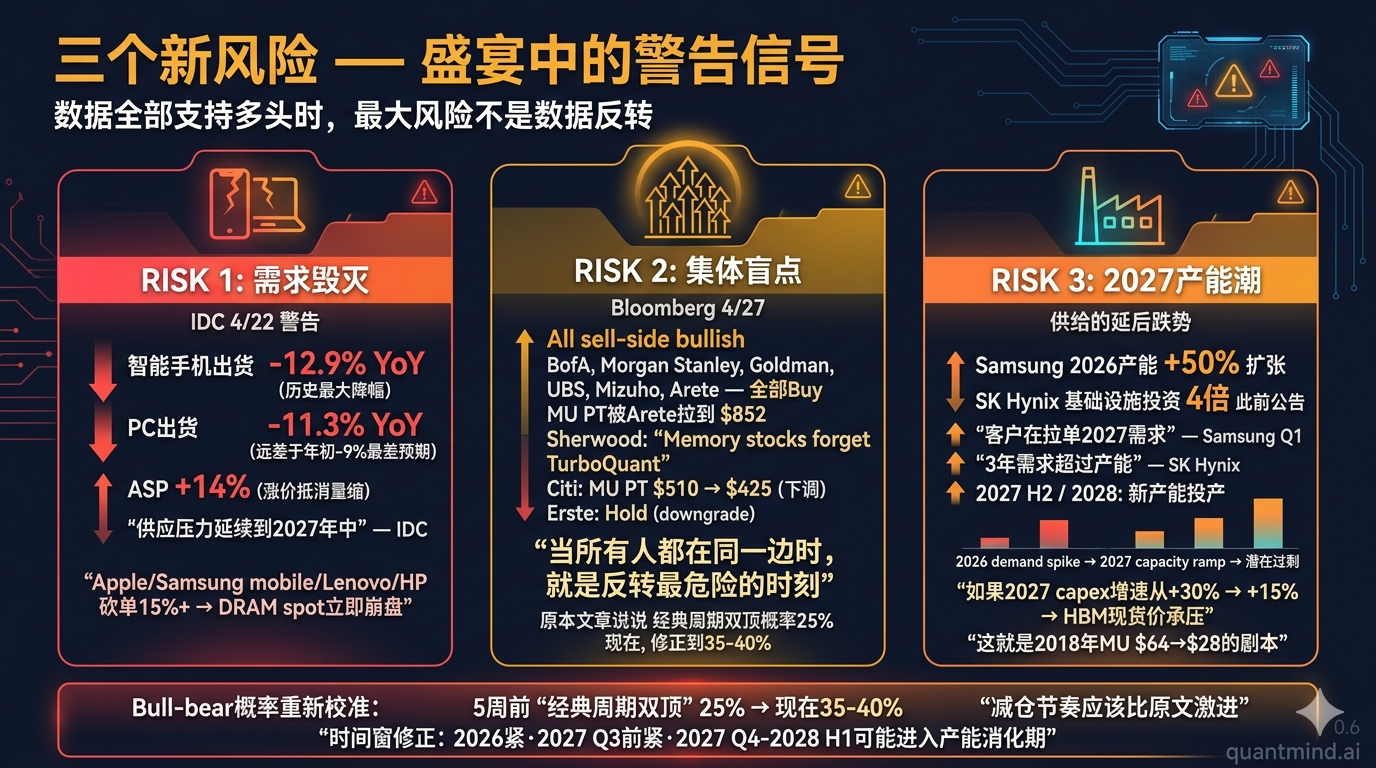
Section 6: New Risks — Why I’m More Nervous, Not Less
Every new data point has supported the thesis. That should make me more bullish. But it doesn’t. Three reasons.
Risk 1: IDC’s “demand destruction” signal
April 22 IDC report:
- Global smartphone shipments forecast -12.9% YoY in 2026 (~1.1B units) — largest decline ever recorded
- PC shipments forecast -11.3% YoY — worse than IDC’s own -9% worst-case from earlier in the year
- ASP +14% (smartphone) / PC market value still +1.6% (price hikes overcoming volume)
This is demand destruction triggered by supply shortage — consumers voting with their wallets.
“Supply pressure persists through 2026 into mid-2027. Prices unlikely to return to 2025 levels within forecast horizon.” — IDC 4/22
Why this is a risk: Memory makers have allocated 93% of capacity to HBM/server DDR5. The consumer shortage is engineered. But if consumer demand cratering exceeds OEM tolerance (e.g., Apple, Samsung mobile, Lenovo, HP cut memory orders 15%+), then memory makers’ spot DRAM pricing suddenly loses support.
Trigger scenario: Apple/Samsung mobile/Lenovo/HP issue Q2/Q3 warnings, slash memory POs by 15%+. DRAM spot would crater immediately.
Risk 2: Bloomberg’s “collective blind spot”
April 27 Bloomberg Opinion ran a headline that should make you reread it twice: “This Chip Supercycle Has One Collective Blind Spot.”
The argument: Everyone is now long memory. Sell-side is uniformly bullish. Sherwood News headline: “Memory stocks forget TurboQuant and remember how to rally.” MU PT pushed to $852 by Arete. When everyone is on the same side, that’s the dangerous moment.
This isn’t technical analysis. It’s market common sense. The original article’s pre-mortem listed “classic cycle double-top” at 25% probability. 5 weeks later, that probability should be 35-40%, not 15% — because crowding has gone up, not down.
More serious: Citi cut MU PT $510 → $425 in April — first counter-consensus bear. Erste downgraded to Hold. These are hedging signals against my bull case that I should listen to seriously.
Risk 3: The 2027 “delayed decline” setup
Samsung said “customers pulling forward 2027 demand.” SK Hynix: “3 years of demand exceeds capacity.” Sounds maximally bullish.
But read it backwards: 2027 orders are already booked into current capacity — meaning the supply expansion hitting 2027 H2 / 2028 will be significant (current capex plans land at that point). Samsung is expanding 2026 capacity by 50%; SK Hynix’s infrastructure investment is 4x prior guidance.
By 2027 Q3/Q4, when new capacity comes online, if AI capex growth slows from +30% in 2026 to +15% (still growing, but decelerating), HBM spot prices come under pressure.
That’s the 2018 MU $64 → $28 playbook — not demand collapse, but supply growth exceeding demand growth.
Impact on my time-window judgment: Original article said “3-5 year structural shortage.” Revised to: “Tight through 2026, tight through 2027 Q3, possible capacity-digestion phase in 2027 Q4 - 2028 H1.”
If you accept this revised time window, trim cadence should be more aggressive than the original suggested — don’t wait until MU $580 to start; start partial trims at $520-540.
Section 7: CXMT Delay — An Underrated Bull Update for MU
The most-overlooked news of the past 5 weeks: April 21 DigiTimes report that CXMT HBM3 mass production timeline is slipping past 2027.
The original article listed “CXMT HBM3 mass production by end-2026” as a bull risk (probability 10%). That probability should drop to 3-5%.
Why this is genuinely good news:
- CXMT initial yields ~50% — meaning even if they enter mass production, unit economics will be poor. <60% yields = essentially no profit.
- Huawei needs 600,000 Ascend 910C; CXMT can only supply HBM for 250-300k — domestic substitution capped at ~50% of demand.
- Huawei/Cambricon/Biren still on HBM2E — 2 generations behind SK Hynix/Samsung HBM3e.
- Naura/AMEC progress on hybrid bonding (NMC612H, Qomola HPD30) is real but not at production scale yet.
Translation: The global HBM oligopoly will not be broken before 2027. MU, SK Hynix, Samsung pricing power stays intact. The “CXMT HBM3 mass production in 2026” bear-trigger from the original article will not fire in 2026.
Side-effect: Huawei being HBM-starved means NVIDIA H100/H200 (if export approved) has more head-room in China — indirectly bullish for MU (HBM customer = NVIDIA). But this is constrained by the January 2026 BIS rule (H200/MI325X case-by-case) so the practical upside is bounded.
Section 8: TurboQuant 5 Weeks Later — Half-Triggered, Not Lethal
March 28’s TurboQuant drop sent MU down 15%. The original article said “this is an add-the-position opportunity.” 5 weeks later, that call was completely correct.
But more importantly: the paper wave has arrived.
| Paper / Framework | Released | Compression | Production Deploy? |
|---|---|---|---|
| TurboQuant | 3/28 | 6x | Not deployed |
| KVTC | ICLR 2026 (April) | 20x | Not deployed |
| TriAttention | 4/11 | 10.7x | Not deployed |
| NVIDIA KVPress | 4/9 | Practical framework | Production-ready |
| Expected Attention | ICLR 2026 | training-free | Not deployed |
| PolyKV / ChunkKV / Norm-Guided | April | Various | Not deployed |
In 5 weeks: at least 6 relevant papers + one NVIDIA production-ready framework. This exceeds the original article’s “3+ papers in 3 months” threshold. The paper-side bear-trigger has fired.
But none of them have hit mainline production in vLLM, TensorRT-LLM, or SGLang. Google’s own TurboQuant isn’t in Search/Gemini production yet.
Morgan Stanley’s hedge: AI context windows growing 30x annually, far outpacing any 6x compression saving. Translation: you compress 6x, but user input context length grew 30x, and the net is memory demand keeps growing.
Verdict: The Jevons paradox call from the original article still holds at 5 weeks, but the threat level moves from “low” to “medium.” I’m revising the bear-trigger from “3+ papers + production deploy” to:
New bear-trigger: vLLM or TensorRT-LLM mainline integration of any 20x+ compression algorithm; OR Google announces TurboQuant in Gemini production.
If either fires, expect MU/Samsung/SK Hynix to drop 5-10% on technical panic — not thesis breakage. That drop is an add-the-position opportunity, conditional on no concurrent order-cut headlines.
Section 9: Updated Decision Framework
Based on 5 weeks of new data, recalibrating each stock’s buy / add / trim / stop:
| Stock | Old Buy | Old Stop | Current | New Trim | New Stop | Action |
|---|---|---|---|---|---|---|
| MU | $280 | $240 | ~$505 | $580/$650 staged | $400 | Hold, no adds |
| DELL | $145 | $125 | $206 | $230 | $170 | Hold, reassess post-print |
| MRVL | $80 | $68 | $157 | $170/$200 staged | $130 | Trim 1/3 |
| PSTG | $48 | $40 | $68 | $85 | $58 | Hold |
| AMAT | $280 | $240 | $417 | $480 | $340 | Hold, no adds before 5/14 |
| LRCX | $180 | $155 | $250 | $300 | $215 | Hold |
| KLAC | $1,200 | $1,050 | ~$1,720 | $2,000 | $1,500 | Hold, no adds |
| WDC | $230 | $200 | $434 | $500 | $340 | Trim 1/3 |
| STX | $320 | $280 | $674 | $800/$950 staged | $550 | Trim 50% |
| ASML | $1,100 | $950 | ~$1,420 | n/a (no position) | n/a | Continue to avoid |
Concrete actions (after 4/30 close):
- MU: Stop raised to $400. No adds, no trims. Wait for FQ3 (late June).
- MRVL: Trim 1/3, lock in +65%.
- WDC: Trim 1/3, lock in +58%.
- STX: Trim 50%, lock in +77% (high leverage + extreme run-up = double risk).
- Cash level: From original 5% → 15% (using trim proceeds). Dry powder for potential 2H 2026 add opportunities.
New position rules:
- Beat-but-fall stocks (e.g., 4/29 KLAC) go on the watch list, not the buy list — early signal of distribution.
- If any memory company misses in Q3 2026 — immediately trim ALL memory positions by 20%. Hard rule, not in the original.
- If Bloomberg, Barron’s, or WSJ publishes 3+ memory-bearish covers — trim 30%. Reverse-sentiment signal.
Section 10: Looking at the Next 30 Days
5 weeks in is the hardest moment to make decisions — every signal supports you, but you know that’s exactly when you should be most careful.
Key events in the next 30 days:
| Date | Event | Watch |
|---|---|---|
| May 14 | AMAT FQ2 print | Does it follow LRCX/KLAC’s WFE raise? |
| ~May 22 | NVDA Q1 FY2027 print | HBM allocation share, Blackwell ramp |
| Late May | DELL FQ1 2027 print | AI server orders, enterprise capex exposure |
| Mid-June | FOMC (potential rate cut) | Cyclical impact |
| Late June | MU FQ3 2026 print | HBM % of DRAM revenue ≥35%? |
Biggest variable: Whether KV cache compression hits production deploy. If yes, expect another 15-20% drawdown on MU/SK Hynix/Samsung — add opportunity, conditional on no concurrent order-cut news.
Overall strategy:
- Core positions (MU, AMAT, LRCX): Hold
- Strategic positions (MRVL, PSTG): MRVL trim 1/3, PSTG hold
- Tactical positions (WDC, STX, KLAC): WDC trim 1/3, STX trim 50%, KLAC hold
- Avoid: ASML (continue)
Position priority by risk-adjusted expected return:
- MU (still best risk/reward at 5 weeks) → wait for FQ3
- AMAT (5/14 print)
- WDC remaining position (pure NAND beta)
- MU additional (if drawdown materializes)
- DELL (DRAM/HBM indirect exposure)
The Biggest Uncertainty I’ll Admit
5 weeks ago I wrote “the market is pricing the new reality with old cycle math.”
5 weeks later the market has partially moved to new math — MU isn’t 7.6x P/E anymore; it’s 12-13x. STX went $380 → $674. KLAC, LRCX hit ATHs.
But what’s the right multiple for the new model?
If HBM truly transformed memory from “18-month cycle” to “3-5 year structural shortage,” MU’s fair multiple is 14-18x mid-cycle EPS ($20-25). Current 12-13x has 20-30% upside.
If it’s just “extended-version 2018” — bigger cycle, still cyclical — MU’s fair value is 8-10x peak EPS — already expensive, time to be careful.
Truth is probably in between. I think 12-13x today is “fair, not cheap” — there’s 20-30% upside, but it’s no longer the “obvious mispricing” of 5 weeks ago.
Implications: - Don’t chase - Trimming partial positions to lock in is reasonable - But fully exiting is also wrong — the supercycle hasn’t reached its final act
A Question I Keep Asking Myself
5 weeks ago I promised readers: “if I’m wrong, here’s where your stop-loss should be.”
5 weeks later, no stops have been hit.
But when every data point is on your side, ask yourself an uncomfortable question:
“If today the market showed me declines instead of advances; if Samsung guided down instead of +50x — how would I read it?”
If you honestly answer “I’d see it as a dip-buy, time to add” — you’re already in confirmation-bias territory.
My honest answer: If Samsung guides down next quarter, I trim 30%. Not because the thesis broke, but because in cyclical stocks the key isn’t “why up” but “when stop.”
5 weeks ago bullishness was easy money.
The next 5 months of bullishness will be hard money.
Knowing when to retreat is harder than knowing when to enter.
6 Lessons from the 5-Week Review
- Triggers matter more than predictions. Of the 11 monitoring triggers I set 5 weeks ago, 9 clearly fired bull. In high-uncertainty environments, a trigger framework beats “I think it’ll go up.”
- Conservative-direction errors are acceptable. Q2 DRAM forecast +20%, actual +58-63%. Wrong, but right direction, position got hit. Errors like that aren’t fatal.
- Acknowledging being underrated matters more than justifying decisions. STX +77%, WDC +58% — both underrated by the original. Calling that an error rather than “I was kinda right” is what enables better calls next time.
- One hyperscaler quote beats 10 sell-side reports. MSFT’s “$25B from higher memory prices” was the most important bullish data point in 5 weeks. Read company primary sources, not analyst translations.
- When everyone agrees with you, start questioning yourself. Bloomberg’s “collective blind spot” is not clickbait — it’s time-tested market wisdom.
- Cyclical exits are harder than entries. 5 weeks ago entries were easy. The next 5 months of selling will be hard. Define your trim cadence — 5-week reviews, lock 1/3 every 10% gain — that beats “I’ll sell at the top” by a factor of 100.
Triggers for the Next Update
The next follow-up will run on any of:
- May 14 AMAT FQ2 print (if it deviates extremely)
- May 22 NVDA Q1 FY2027 print (HBM allocation data)
- Within 24 hours of any memory company miss
- June end MU FQ3 print (unconditional)
If you built positions following the original article — remember: +33% in 5 weeks is exceptional. Set your stops, define your trim cadence. This isn’t an exit signal — it’s a lock-the-gains, prepare-for-reversal discipline.
Follow-up to the “Geopolitical Edge” series. Original: HBM Supercycle | ASML/TSM Q1 2026 | Big Tech Q1 2026
Disclaimer: Research and educational purposes only, not investment advice. Data through 2026-04-30 close.