Mar 23, 2026
After Gold Breaks $5,000: Precious Metals Investment Deep Dive
Central bank de-dollarization x Hormuz crisis safe haven x Silver industrial supply deficit. 10 precious metals stocks analyzed — gold miners, streamers, and silver plays.
Part 3 of “The Geopolitical Edge” Investment Series
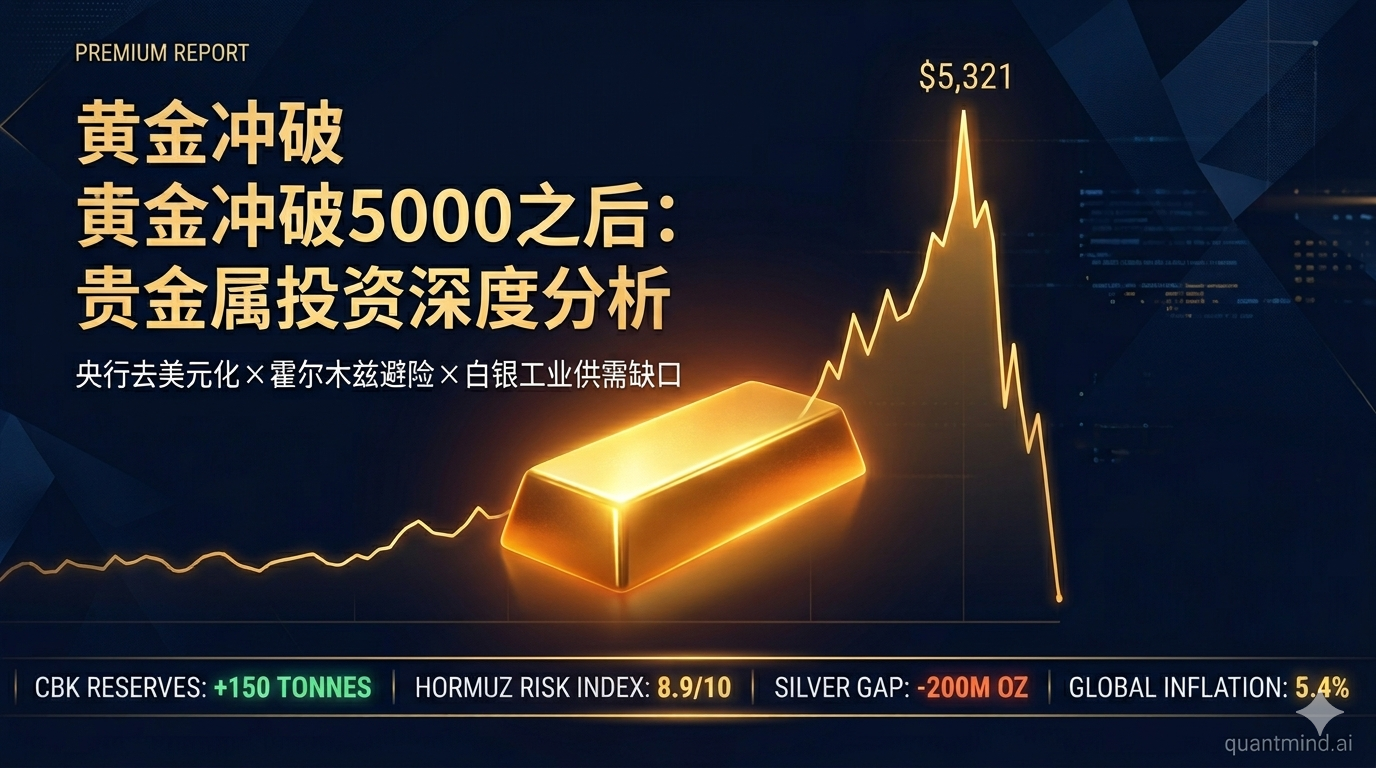
$5,321. Then silence.
On March 3, 2026, gold printed a number that would have seemed hallucinatory two years ago — $5,321 per ounce. Central banks were buying at a pace not seen since Bretton Woods collapsed. The Strait of Hormuz was choking global oil flows. The dollar’s reserve status was under open question for the first time in a generation.
Then the Fed spoke. On March 18, the FOMC held rates at 3.50-3.75%, revised inflation expectations upward, and killed the rate-cut dream. Gold crashed 15% in two weeks, bottoming near $4,520. GLD hemorrhaged $2.9 billion in a single day — the largest ETF outflow in a decade. Silver dropped 10% in one week.
But here’s what the liquidation crowd is missing: 77% of central banks intend to increase gold reserves. The PBOC is on a 15-month buying streak. Silver is entering its sixth consecutive supply deficit. And mining margins are running at ~$2,800/oz — the most profitable period in the industry’s history.
I ran full fundamental analysis on 10 precious metals stocks — majors, mid-tiers, streamers, and royalty companies — across valuation, financial health, earnings quality, peer comparisons, and intrinsic value. Here’s the complete breakdown.
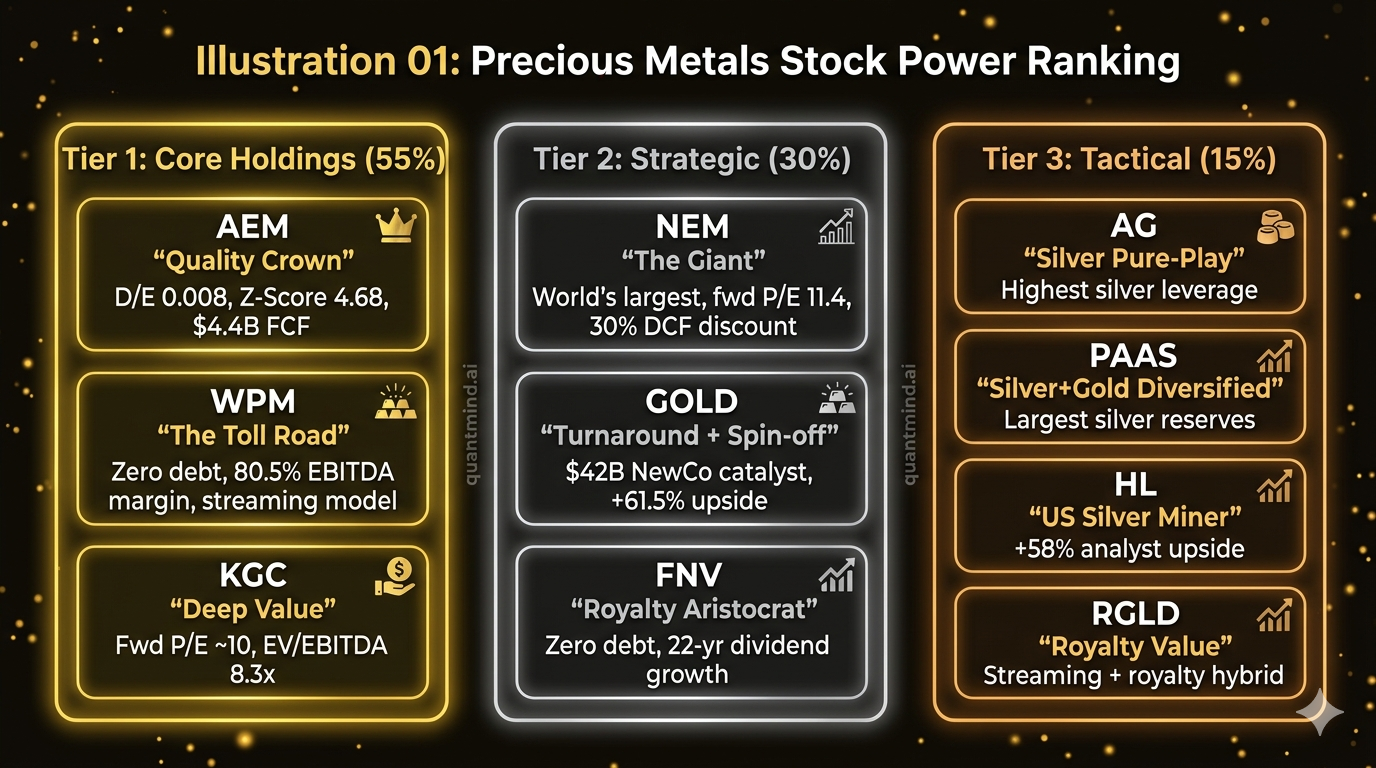
TL;DR: - Best Value: KGC (Kinross) — fwd P/E ~10, EV/EBITDA 8.3, record $2.5B FCF, cheapest gold stock - Highest Quality: AEM (Agnico Eagle) — D/E 0.008, Z-Score 4.68, $4.4B record FCF, near-zero debt - Best Risk-Adjusted: WPM (Wheaton) — zero debt, 80.5% EBITDA margins, 50% production growth to 2030 - Best Risk/Reward: NEM (Newmont) — 30% DCF discount, 9/9 Piotroski, 118.2M oz reserves, $7.3B FCF - Highest Upside: GOLD (+61.5% to consensus), HL (+58.1%) - All 10 stocks: Healthy. The sector is flush with cash. No red flags.
Three Forces Driving Precious Metals
Force 1: Central Bank De-dollarization — The Structural Bid That Never Stops
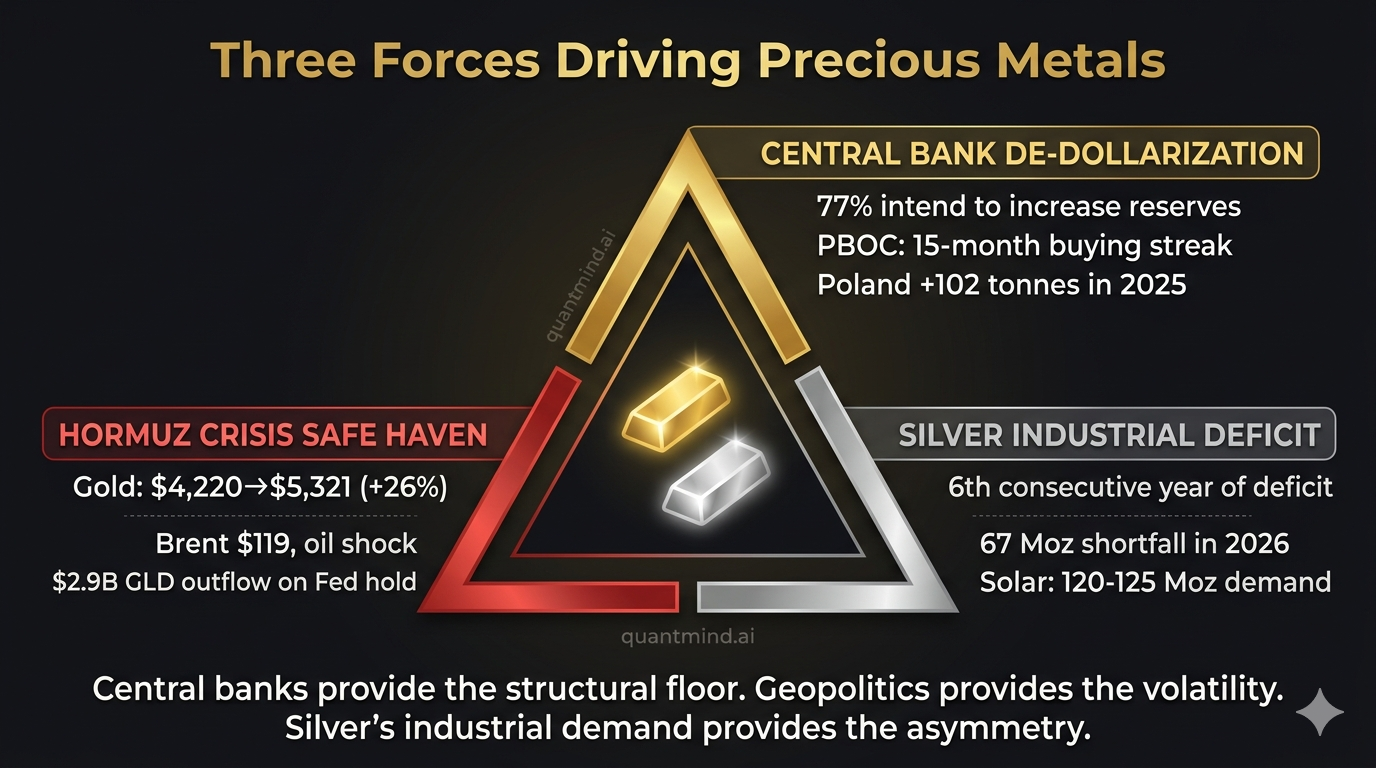
Central bank gold purchases are the single most powerful structural driver of this market. According to the World Gold Council, 77% of central banks now intend to increase gold reserves over the next 12 months — the highest level of intent ever recorded.
The numbers tell the story:
- China (PBOC): Reserves at approximately 2,308 tonnes after a 15-month consecutive buying streak (~40,000 oz/month). This is not tactical — it is strategic diversification away from US Treasuries and Western financial system exposure.
- Poland (NBP): Added 102 tonnes in 2025 alone, bringing reserves to 550 tonnes. Poland has publicly raised its target share of reserves held in gold — a rare signal of strategic commitment from a NATO member.
- Turkey (CBRT): 27 tonnes purchased through October 2025, lifting holdings to 644 tonnes. Steady accumulation continues into 2026.
- India (RBI): Joined the “gold-buying vanguard,” aggressively rotating out of foreign currency reserves.
The re-imposition of US tariffs has accelerated the rotation. Emerging market central banks — India, Turkey, Brazil, and others — are systematically reducing dollar reserve exposure. Gold serves as a neutral reserve asset that sidesteps default risk, counterparty exposure, and sanctions vulnerability. This is not a trade. It is a regime change in global reserve management.
Force 2: Hormuz Crisis Safe Haven — The Paradox That Created the Buying Opportunity
The 2026 Strait of Hormuz crisis represents the most significant geopolitical shock to commodities markets since the 1970s. Operation Epic Fury (February 28, 2026) triggered Iranian disruption of the Strait, through which 20% of global oil supply flows. Brent crude surpassed $126/bbl.
Gold’s response was paradoxical. Initial safe-haven demand drove gold up 5.2% to $5,246/oz by March 1. But the oil shock then raised inflation expectations, forcing the Fed into a hawkish stance and pushing real yields higher. The surge in producer costs stripped the Fed of its ability to cut rates. Gold, counterintuitively, fell on a geopolitical crisis.
Why this creates opportunity: The paradox is temporary. If Hormuz resolves, the oil shock dissipates, inflation expectations normalize, and the Fed regains room to cut — which is bullish for gold via the rate channel. If Hormuz escalates, the safe-haven bid eventually overwhelms the rate headwind as economic damage forces policy reversal. Either outcome is structurally positive for gold at a 6-12 month horizon.
Force 3: Silver Industrial Supply Deficit — Six Years and Counting
Silver’s dual identity as precious and industrial metal is increasingly tilting toward the latter, and the supply side cannot keep up:
- Solar PV: 665 GW of global capacity in 2026, consuming 120-125 million ounces of silver. Each panel contains 15-25 grams. Solar now accounts for ~19% of all worldwide silver demand.
- Electric vehicles: 14-15 million units forecast in 2026, consuming 70-75 million ounces. EV’s share of silver industrial demand surged from 11% (2014) to 29% (2024).
- Data centers and AI: The fastest-growing electronics category for silver consumption — thermal management, high-speed networking, and power electronics all require silver’s superior conductivity.
The result: a sixth consecutive annual structural deficit of 67 million ounces in 2026. Even at decade-high supply levels (1.05 billion ounces), the market cannot keep pace. Five years of deficits have meaningfully depleted above-ground inventories. A physical squeeze scenario remains possible.
Where the Money Is: Precious Metals Value Chain
| Segment | Margin Profile | Key Players | Structural Advantage |
|---|---|---|---|
| Gold Majors | High margin ($2,800+/oz), cyclical | NEM, GOLD, AEM, KGC | Largest FCF generation, reserve optionality, scale |
| Silver Miners | Very high margin at $72 Ag, volatile | AG, PAAS, HL | Maximum leverage to silver price, industrial demand tailwind |
| Streamers/Royalties | Highest margin (80%+), lowest risk | WPM, FNV, RGLD | No operating risk, no capex, built-in optionality |
| Physical/ETFs | Zero margin (cost of carry) | GLD, SLV, PHYS | Direct exposure, liquidity, no company-specific risk |
The key insight: Streamers and royalty companies capture 80%+ margins with zero mine-level operating risk. Miners offer greater leverage to metal prices but carry AISC inflation, jurisdiction, and execution risk. Physical/ETFs are the simplest exposure but offer no operating leverage. The optimal portfolio combines all three.

The Power Ranking: 10 Precious Metals Stocks Analyzed
Tier 1: Core Holdings
NEM — Newmont Corporation | $95.80 | Market Cap: $104.2B
The World’s Largest Gold Miner — Best Risk/Reward in the Sector
| Metric | Value | Signal |
|---|---|---|
| P/E (TTM) | 17.2x | Below 25th pct among gold majors |
| Forward P/E | 11.4x | Attractive — strong earnings growth |
| EV/EBITDA | 8.4x | Significant discount to peers |
| EBITDA Margin | 59.4% | Exceptional operating leverage |
| FCF (FY2025) | $7.3B (record) | 146% YoY growth |
| FCF Yield | ~6.3% | Best cash generation in sector |
| ROE | 22.3% | Excellent |
| Beat Rate | 80% (4/5) | Strong, improving |
| Avg Surprise (3Q) | +44.6% | Analysts far behind |
| Altman Z-Score | 5.04 | SAFE ZONE |
| Piotroski F-Score | 9/9 | PERFECT |
| Gold Reserves | 118.2M oz | Largest reserve base globally |
| AISC (FY2025) | $1,358/oz | Below sector average |
| Mine Life | ~20 years | Long duration |
| Debt/Equity | 0.155 | Conservative |
| Net Cash | $2.5B | Fortress |
Bull case: Rare combination of cheapest valuation (fwd P/E 11.4) AND best fundamental quality (9/9 Piotroski, 5.04 Z-Score). Record $7.3B FCF with 146% growth. 118.2M oz reserve base provides 20 years of mine life. DCF fair value of $124 implies 30% upside. Analysts consistently underestimate NEM’s earnings power — average surprise of +44.6% across last 3 quarters.
Bear case: 2026 AISC guidance of $1,680/oz represents 24% cost inflation. Production guidance of 5.26M oz is 11% below 2025’s record 5.9M oz. Newmont-Barrick NGM legal standoff creates headline risk.
Gold price sensitivity: Every $100/oz gold move = ~$590M annual FCF impact.
Action: BUY. Best risk/reward in precious metals. Cheap, healthy, massive reserve base, record cash flows.
AEM — Agnico Eagle Mines | $179.13 | Market Cap: $89.7B
The Premium Quality Miner — Sleep-at-Night Gold Stock
| Metric | Value | Signal |
|---|---|---|
| P/E (TTM) | 20.2x | Reasonable quality premium |
| Forward P/E | 15.3x | Moderate |
| Gross Margin | 72.0% | Best-in-class among miners |
| FCF (FY2025) | $4.4B (record) | Exceptional |
| ROE | ~25.0% | Excellent |
| Debt/Equity | 0.008 | Near-zero leverage |
| Interest Coverage | 268.6x | Extraordinary |
| Altman Z-Score | 4.68 | SAFE ZONE |
| Total Debt | $196M | Minimal |
| Net Cash | $2.04B | Positive |
| Gold Reserves | 55.4M oz (record) | Growing |
| AISC (FY2025) | $1,339/oz | 2nd lowest among miners |
| Beat Rate | ~88% (8Q) | Highly reliable |
| Dividend Growth | 12.5%/yr | Compounding |
Bull case: Cleanest balance sheet in precious metals — D/E collapsed from 28.5% to 0.8% over 5 years. $196M total debt on a $90B market cap is extraordinary. Best-in-class 72% gross margins. Record reserves of 55.4M oz. AEM consistently delivers what it promises, earning a “premium miner” reputation that justifies a structural valuation premium.
Bear case: EV/EBITDA of 14.0x is above sector median. Limited upside to analyst consensus (+14.4%). Quality premium limits deep discount opportunities.
Gold price sensitivity: Every $100/oz gold move = ~$345M annual FCF impact.
Action: BUY. The highest-quality gold miner in the world. Core position for any precious metals portfolio.
KGC — Kinross Gold | $26.50 | Market Cap: $44.1B
The Cheapest Gold Stock — Value Play with Growth Pipeline
| Metric | Value | Signal |
|---|---|---|
| P/E (TTM) | 14.9x | Cheapest gold stock analyzed |
| Forward P/E | ~10.0x | Very attractive |
| EV/EBITDA | 8.3x | Below sector median |
| Net Margin | 35.0% | Strong |
| EBITDA Margin | 59.6% | Excellent |
| FCF (FY2025) | $2.5B (record) | Exceptional |
| Shareholder Returns | $1.5B (FY2025) | Aggressive buybacks + dividends |
| Debt/Equity | 0.16 | Conservative |
| Current Ratio | 2.83 | Healthy liquidity |
| AISC (FY2025) | $1,571/oz | Mid-range |
| Production | ~2.0M oz/yr | Stable through 2028 |
| Reserves (P&P) | ~20M oz | ~10 year mine life |
| Margin Expansion | 66% vs 43% gold | Operating leverage demonstrated |
Bull case: Cheapest gold stock on every valuation metric (fwd P/E ~10, EV/EBITDA 8.3). Record $2.5B FCF. Returned $1.5B to shareholders in 2025. Margins expanded 66% while gold rose 43% — demonstrating genuine operating leverage. Growth projects (Round Mountain Phase X, Great Bear) extend mine lives to 2038+. No debt maturities until 2033.
Bear case: Shortest mine life (~10 years) among majors. 2026 AISC guidance of $1,730/oz represents 10% cost inflation. Resources growing (+6% YoY) but reserves need continued replenishment.
Gold price sensitivity: Every $100/oz gold move = ~$200M annual FCF impact.
Action: BUY. Best pure value play in gold. The market is pricing KGC as if gold is going back to $3,000.
WPM — Wheaton Precious Metals | $115.00 | Market Cap: $52.0B
The Ultimate Risk-Adjusted Play — Streaming Model Perfection
| Metric | Value | Signal |
|---|---|---|
| P/E (TTM) | 35.4x | Premium — streaming model |
| Forward P/E | 28.9x | Elevated but structural |
| EBITDA Margin | 80.5% | Industry-best |
| EBIT Margin | 64.8% | Excellent |
| Debt/Equity | 0.00 | Zero debt |
| Undrawn Revolver | $2.0B | Acquisition capacity |
| Beat Rate | ~80% | Strong |
| Q4 2025 EPS Surprise | +18.6% | Improving trend |
| 2025 GEOs | 692K | Guidance achieved |
| 2026 GEOs Guidance | 860-940K | +24-36% growth |
| 2030 GEOs Outlook | 1.2M | +50% from 2025 |
| Cost per GEO | ~$400-500/oz | Fixed — no AISC risk |
| Analyst Target | $140.44 | +22.1% upside |
Bull case: Zero debt. 80.5% EBITDA margins. No mine-level operating risk. No capex obligations. Fixed per-ounce cost of ~$400-500 means the margin at $4,660 gold is ~$4,160-4,260 per GEO. 50% production growth to 2030 (Antamina expansion +70K GEOs). This is the lowest-risk way to own precious metals exposure, period.
Bear case: Premium valuation (29x forward P/E) prices in significant growth. EV/EBITDA of 44.8x is the highest in the peer group. No operating leverage beyond metal price — WPM cannot cut costs further because costs are already minimal.
Action: BUY. Best risk-adjusted precious metals investment. Core streaming allocation.
Tier 2: Strategic Positions
GOLD — Barrick Mining | $37.14 | Market Cap: $78.1B
The Copper-Gold Hybrid — Highest Analyst Upside
| Metric | Value | Signal |
|---|---|---|
| P/E (TTM) | 27.9x | Above sector median |
| Forward P/E | ~14.0x | Reasonable on forward |
| EV/EBITDA | 8.5x | In-line with NEM |
| Beat Rate | 100% (4/4) | Perfect |
| Avg Surprise | +16.6% | Consistent |
| Debt/Equity | 0.14 | Excellent |
| Interest Coverage | 44.1x | Strong |
| Gold Reserves | 85M oz | 25+ year mine life |
| Copper Reserves | 18M tonnes | Significant diversification |
| AISC (FY2025) | ~$1,450/oz | Mid-range |
| Analyst Consensus | $60.00 | +61.5% upside |
Bull case: Highest analyst upside in the group at +61.5%. 100% beat rate with consistent 16.6% average surprise. Copper optionality from Reko Diq and Lumwana (18M tonnes P&P reserves) adds asymmetric upside not captured in most models. 85M oz gold reserves provide 25+ year mine life. The proposed $42B North American spin-off could unlock significant value if executed.
Bear case: TTM P/E of 27.9x is elevated. Africa/Sahel jurisdiction risk (geopolitical instability). The Newmont legal standoff over Nevada Gold Mines creates uncertainty around the spin-off. 2026 AISC guidance of $1,760-$1,950/oz represents 20%+ cost inflation.
Action: HOLD/ACCUMULATE. Attractive on forward estimates and analyst targets, but execution risk on spin-off and jurisdiction concerns warrant a smaller position than NEM or AEM.
PAAS — Pan American Silver | $46.73 | Market Cap: $19.8B
The Diversified Silver Major — Best Scale + Dual Metal Exposure
| Metric | Value | Signal |
|---|---|---|
| P/E (TTM) | 18.2x | Cheapest silver miner |
| Forward P/E | 17.4x | Reasonable |
| EV/EBITDA | 14.1x | In-line |
| Dividend Yield | 1.54% | Highest in silver space |
| Silver Production | 22.8M oz | Beat guidance |
| Gold Production | 742.2K oz | Significant dual exposure |
| Silver AISC | $13.88/oz | Industry-leading |
| Gold AISC | $1,621/oz | Competitive |
| Q4 Revenue | $1.18B (record) | Strong |
| Q4 Net Earnings | $452M | Impressive |
| Total Liquidity | $2,069M | Excellent |
| Analyst Target | $56.60 | +21.1% upside |
Bull case: Largest primary silver miner by scale, with meaningful gold diversification (742K oz). Silver AISC of $13.88/oz delivers $58/oz margin at $72 silver. Juanicipio mine ramping to full-year production in 2026 — low-cost, high-margin ounces. Dividend increased 29%. Cheapest P/E among silver miners.
Bear case: Latin American jurisdiction risk (Mexico, Peru, Guatemala). 2026 silver AISC guidance of $15.75-$18.25/oz represents significant cost inflation. Down 33% from 52-week high — momentum is negative.
Silver price sensitivity: Every $5/oz silver move = ~$114M annual revenue impact.
Action: BUY. Best combination of value, scale, and dual metal exposure in silver.
FNV — Franco-Nevada | $251.87 | Market Cap: $48.6B
The Royalty King — Quality at a Price
| Metric | Value | Signal |
|---|---|---|
| P/E (TTM) | 47.9x | Premium — royalty model |
| Forward P/E | 31.9x | Still rich |
| Net Margin | ~60.0% | Exceptional |
| Revenue (FY2025) | $1,822.8M (record) | +86% YoY |
| Net Income (FY2025) | $1,112.1M | Record |
| Debt | $0 | Zero |
| Available Capital | $3.1B | Enormous acquisition capacity |
| Dividend Streak | 19 consecutive increases | Compounder |
| Geographic Mix | 88% Americas | Low geopolitical risk |
| Revenue Concentration | No asset >13% | Well diversified |
| 2026 GEO Guidance | 510-570K | Stable |
| Cobre Panama | Excluded from guidance | Potential upside catalyst |
Bull case: Highest-quality royalty vehicle in existence. Zero debt, $3.1B acquisition capacity, 19 consecutive dividend increases, 88% Americas exposure. Record revenue of $1.82B (+86% YoY). Cobre Panama resolution would be a major upside catalyst not priced in. FNV trades on scarcity premium — there is no replacement for this franchise.
Bear case: Significantly overvalued on DCF (fair value $91 vs $252 price). P/E of 47.9x prices perfection. Analyst consensus at $233 implies 7.5% downside. Organic growth of only 13% to 2030 is modest versus WPM’s 50%.
Action: HOLD. Own for quality, but size the position small given premium valuation. Add aggressively on any pullback below $220.
Tier 3: Tactical / High-Beta Positions
AG — First Majestic Silver | $18.27 | Market Cap: $10.8B
The Silver Pure-Play — Maximum Leverage
| Metric | Value | Signal |
|---|---|---|
| P/E (TTM) | 53.1x | Elevated — transitional year |
| Forward P/E | ~22.0x | More reasonable |
| Revenue (FY2025) | $1.26B | +125% YoY |
| Profit Swing | -$102M to +$211M | Dramatic turnaround |
| Silver Production | 15.4M oz (record) | +84% YoY |
| Net Cash | ~$500M | Positive |
| AISC (AgEq) | ~$23.60/oz | Higher than PAAS/HL |
| Revenue Split | 60% silver / 40% gold | Silver-weighted |
| Los Gatos Expansion | To 4,000 tpd | Key catalyst |
| Analyst Target | $21.92 | +20.0% upside |
Bull case: Highest leverage to silver prices in this group. Los Gatos acquisition was transformative — drove 84% silver production growth and swung the company from -$102M loss to +$211M profit. Net cash of ~$500M after being cash-burning. Santo Nino discovery (>95% recovery rates) provides exploration upside. At $72 silver, margins are substantial.
Bear case: Health rating is “Watch” — historically volatile operations. Highest AISC among silver miners at $23.60/oz. 2026 guidance shows lower production (13.0-14.4M oz vs 15.4M in 2025). Mexico jurisdiction risk.
Action: SPECULATIVE BUY. High-beta silver play for aggressive portfolios. Size small — 3-5% max.
HL — Hecla Mining | $17.24 | Market Cap: $11.6B
The US Silver Champion — Jurisdiction Premium
| Metric | Value | Signal |
|---|---|---|
| P/E (TTM) | 35.2x | Premium for US jurisdiction |
| Forward P/E | 32.2x | Still elevated |
| EV/EBITDA | 31.2x | Above 75th pct |
| Revenue (FY2025) | $1.4B (+53%) | Record |
| Net Income (FY2025) | $321M | Strong |
| Silver Production | 17.03M oz | Record |
| Silver Reserves | 231M oz | Peer-leading |
| Reserve Life | 13+ years | Industry-leading |
| AISC (Silver) | ~$14.00/oz | Competitive |
| Greens Creek AISC | Negative | After byproduct credits |
| Net Leverage | 0.1x | Near net-zero |
| Analyst Target | $27.25 | +58.1% upside |
Bull case: Second-highest analyst upside at +58.1%. Only major US-based silver producer — jurisdiction premium in a world of rising resource nationalism. Greens Creek mine produces silver at effectively zero cost after byproduct credits — at $72/oz, the entire revenue stream is pure margin. 231M oz silver reserves with 13+ year mine life. Record $55M exploration budget for 2026.
Bear case: Deeply overvalued on DCF ($5.18 fair value vs $17.24 price). Forward P/E of 32.2x prices significant silver upside already. Health rating is “Watch.” High-beta means sharp drawdowns in corrections.
Action: SPECULATIVE HOLD. Attractive US jurisdiction and reserve base, but valuation is stretched. Best entered on a 15-20% pullback.
RGLD — Royal Gold | $225.07 | Market Cap: $20.6B
The Steady Compounder — 25 Years of Dividend Growth
| Metric | Value | Signal |
|---|---|---|
| P/E (TTM) | 36.3x | Premium — royalty model |
| Forward P/E | 16.3x | Attractive on forward |
| Gross Margin | 87.7% | Highest in peer group |
| Revenue (FY2025) | $1.0B (record, +43%) | Milestone |
| Operating Cash Flow | $705M (record) | Strong |
| Net Debt/EBITDA | 1.0-1.5x | Moderate |
| Total Debt | $1.225B | Plans to repay by mid-2027 |
| Dividend Streak | 25 consecutive increases | Compounder |
| Earnings Growth | 20.9%/yr | Strong |
| Analyst Target | $231.14 | +2.7% upside |
Bull case: 87.7% gross margin is the highest in the entire peer group. 25 consecutive years of dividend increases — the longest streak among precious metals royalty companies. Forward P/E of 16.3x is the most attractive among royalty/streaming names. Investor Day on March 31 could be a catalyst. Revenue crossed $1B for the first time.
Bear case: Q4 2025 EPS miss (-56.4%) — likely one-time charges but creates near-term uncertainty. Only 2.7% upside to analyst consensus. Debt of $1.225B is unusual for the royalty space (from acquisition).
Action: HOLD. Steady compounder for income-oriented portfolios. Limited near-term upside.
Gold Price Scenario Matrix
| Stock | Gold $4,000 (-10%) | Gold $4,500 (Current) | Gold $5,500 (+22%) | Gold $6,000+ (+33%) |
|---|---|---|---|---|
| NEM | Strong — $2,300 margin, FCF ~$5B | Very Strong — $3,100 margin, $7B+ FCF | Exceptional — $4,100 margin, $10B+ FCF | Extraordinary — record margins, buyback acceleration |
| AEM | Strong — quality premium holds | Very Strong — $3,100 margin | Exceptional — FCF could exceed $6B | Extraordinary — potential special dividends |
| KGC | Moderate — $2,300 margin, thin at cost | Strong — $2,900 margin | Very Strong — $3,900 margin | Exceptional — re-rating catalyst |
| GOLD | Moderate — copper provides floor | Strong — dual metal upside | Very Strong — spin-off accelerates | Exceptional — copper + gold double catalyst |
| WPM | Strong — $3,500+ streaming margin | Very Strong — $4,100+ margin | Exceptional — zero cost leverage | Extraordinary — streaming model shines brightest |
| FNV | Moderate — premium valuation compresses | Fair — fully valued | Strong — premium expands | Very Strong — scarcity premium justified |
| PAAS | Moderate — gold hedges silver weakness | Strong — dual exposure | Very Strong — margin expansion | Exceptional — silver likely follows gold |
| AG | Weak — highest AISC, margin squeeze | Moderate — healthy margins | Strong — leverage amplifies | Very Strong — high beta swings hard |
| HL | Weak — valuation vulnerable | Moderate — byproduct helps | Strong — US jurisdiction premium | Very Strong — reserve value re-rates |
| KGC | Moderate — value floor | Strong — cheapest stock | Very Strong — margin expansion | Exceptional — largest re-rating |
Silver Price Overlay
| Silver Price | $50 (-30%) | $72 (Current) | $100 (+39%) | $150+ (Squeeze) |
|---|---|---|---|---|
| AG | Margin squeeze, -40% risk | Healthy $48/oz margin | Explosive — $76/oz margin | Super-cycle — multi-bagger |
| PAAS | Protected by gold exposure | Strong $58/oz margin | Very Strong — dual leverage | Exceptional — scale advantage |
| HL | Greens Creek still profitable | Pure margin at $72 | Massive leverage | US silver champion re-rates |
Portfolio Construction
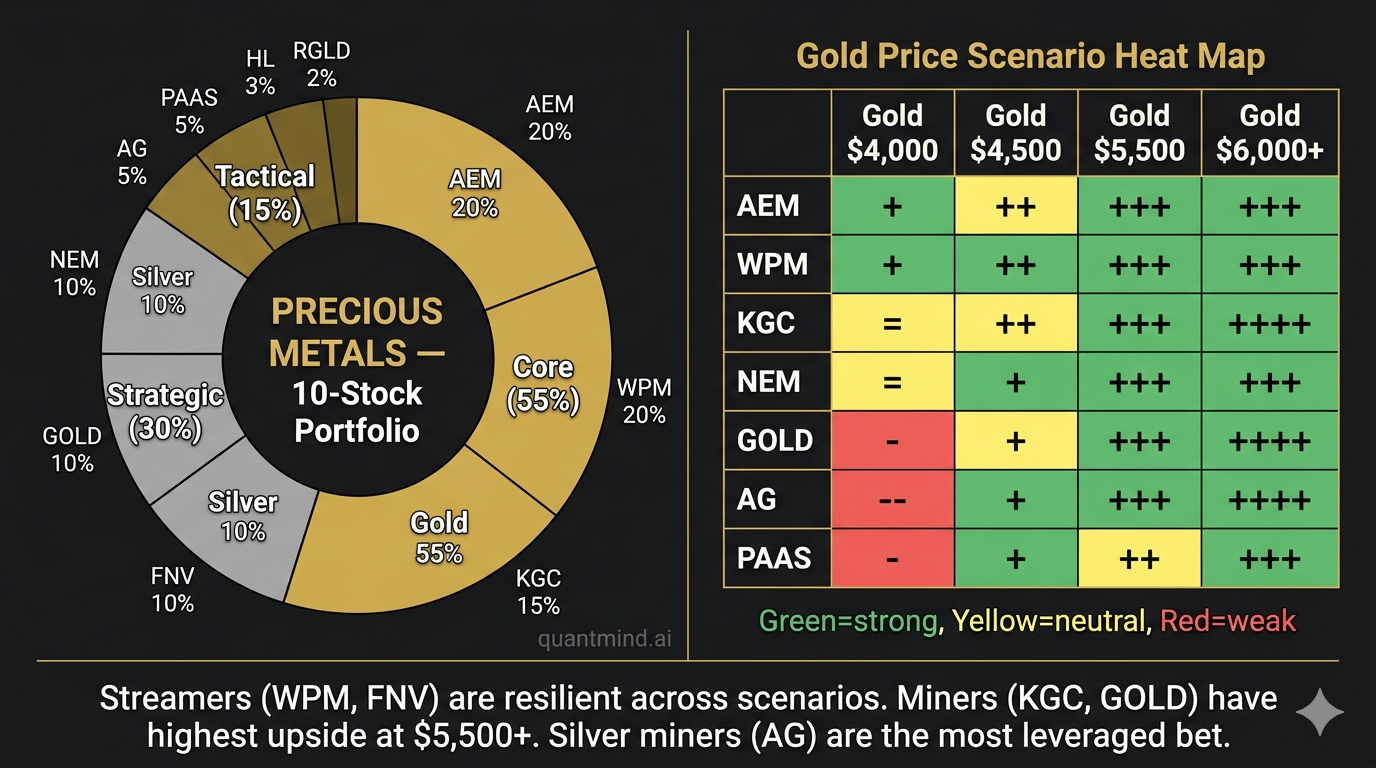
| Tier | Stock | Allocation | Rationale |
|---|---|---|---|
| Core (55%) | NEM | 15% | Best risk/reward: cheap, healthy, largest reserves, record FCF |
| AEM | 15% | Highest quality: near-zero debt, best margins, reliable execution | |
| KGC | 10% | Best value: fwd P/E ~10, record FCF, operating leverage proven | |
| WPM | 15% | Best risk-adjusted: streaming model, zero debt, 50% growth to 2030 | |
| Strategic (30%) | GOLD | 10% | Copper optionality, 61.5% analyst upside, 25-year mine life |
| PAAS | 10% | Silver scale + gold diversification, cheapest silver P/E | |
| FNV | 5% | Quality royalty compounder, 19-year dividend streak | |
| RGLD | 5% | 25-year dividend streak, 87.7% gross margin | |
| Tactical (15%) | AG | 5% | Maximum silver leverage, Los Gatos transformation |
| HL | 5% | US jurisdiction premium, Greens Creek negative AISC | |
| Physical/ETF | 5% | GLD/SLV for liquidity and rebalancing |
Allocation philosophy: 55% core provides downside protection through quality and value. 30% strategic adds growth and optionality. 15% tactical captures high-beta upside in silver and physical positioning.
6 Investment Philosophy Perspectives
| Philosophy | Verdict | Rationale | Biggest Risk |
|---|---|---|---|
| Quality Compounder (Buffett) | LONG AEM, WPM | Near-zero debt, durable margins, growing dividends, compounding FCF | Gold price reversal compresses even quality names |
| Imaginative Growth (Baillie Gifford) | LONG AG, HL | Silver supply deficit + solar/EV industrial demand = structural demand shift | Extreme volatility, high-beta drawdowns |
| Fundamental L/S (Tiger Cubs) | LONG KGC, NEM / SHORT FNV | Deep value miners vs overvalued royalty premium | FNV scarcity premium persists |
| Deep Value (Klarman) | LONG KGC, NEM | Fwd P/E 10-11, 30% DCF discounts, record FCF — margin of safety exists | AISC inflation erodes margin of safety |
| Catalyst-Driven (Tepper) | LONG GOLD, PAAS | Barrick spin-off + Juanicipio ramp = near-term catalysts | Execution delays, legal standoff |
| Macro Tactical (Druckenmiller) | LONG gold broadly, OVERWEIGHT silver | Central bank regime change, silver supply deficit, real yield peak | Fed stays hawkish longer than expected |
Variant View
Market consensus: Gold is a crowded trade. The $5,321 spike was the blow-off top. GLD’s $2.9B single-day outflow signals smart money exiting. At $4,520, gold is still up 48% year-over-year — the easy money has been made.
What the market is missing: The ETF outflow is paper deleveraging, not structural abandonment. While GLD saw record redemptions, central banks bought more gold in the same week. The divergence between paper selling and physical accumulation is the defining market tension of 2026. Consider:
- 77% of central banks intend to increase reserves — the highest intent ever recorded
- PBOC’s 15-month buying streak shows no sign of slowing — this is geopolitical strategy, not tactical trading
- Silver’s sixth consecutive deficit has depleted above-ground inventories to levels that make a physical squeeze plausible
- Mining margins at ~$2,800/oz mean the industry is generating record cash flows that will flow into buybacks, dividends, and exploration — creating a virtuous cycle
- All 10 stocks analyzed are financially healthy — no balance sheet stress, no refinancing risk, no distress
The consensus sees a crowded trade. We see a structural regime change in global reserve management that has years, not months, to run. The $5,321 spike may have been premature. The $4,520 pullback is the entry point.
Pre-Mortem: Three Ways This Goes Wrong
1. Fed Wins the Inflation Fight — Real Yields Surge
If the Hormuz crisis resolves quickly, oil normalizes, but the Fed keeps rates at 3.50-3.75% (or higher) through 2027 to crush lingering inflation, real yields could surge to 2.5%+. Gold’s opportunity cost rises sharply. Historical precedent: 2013-2015 gold bear market when real yields normalized. Impact: gold to $3,500-3,800, miners give back 30-40%.
2. Central Bank Buying Decelerates
The entire structural thesis rests on sovereign demand. If the PBOC pauses (as it did for 6 months in 2024), Poland and Turkey slow purchases, and the de-dollarization narrative cools amid a trade deal or geopolitical detente, the marginal buyer disappears. Gold loses its structural bid and reverts to being a rate-sensitive asset. Impact: gold to $3,800-4,000, streamers underperform due to premium compression.
3. Silver Industrial Demand Disappointment
If solar installations slow (tariff disruption, grid bottleneck), EV sales plateau, or silver substitution technologies emerge (copper nanowire, aluminum paste), the structural deficit thesis breaks. Silver falls to $45-50/oz, and silver miners (AG, HL, PAAS) suffer 40-50% drawdowns. The gold-to-silver ratio blows out above 90x, signaling industrial distress.
Monitoring Variables and Action Triggers
| Variable | Current State | Bull Trigger | Bear Trigger | Data Source |
|---|---|---|---|---|
| PBOC Monthly Gold Purchases | ~40K oz/month, 15-month streak | Acceleration above 50K oz/month | Pause or reduction below 20K oz/month | PBOC/World Gold Council |
| Fed Funds Rate | 3.50-3.75% | Cut to 3.25% or lower | Hike or hold through Q1 2027 | FOMC statements |
| 10Y Real Yield (TIPS) | ~1.5% | Decline below 1.0% | Surge above 2.5% | FRED/Treasury |
| Silver Supply Deficit | 67 Moz (6th year) | Deficit widens above 80 Moz | Deficit narrows below 30 Moz | Silver Institute |
| GLD ETF Flows | Net outflows March 2026 | 3 consecutive months of inflows | Continued outflows exceeding $5B/month | World Gold Council |
| Gold-to-Silver Ratio | 62-65x | Decline below 55x (silver outperformance) | Surge above 80x (industrial distress) | Market data |
| Brent Crude | ~$100+/bbl (Hormuz) | Normalization to $75-85 (allows Fed cuts) | Sustained above $120 (stagflation) | EIA/ICE |
| Barrick Spin-Off | Legal standoff with Newmont | Resolution + spin-off proceeds | Spin-off abandoned or delayed to 2027+ | Company filings |
| Mining AISC Inflation | 10-20% guided increases (2026) | Costs stabilize or decline | Costs exceed guidance by >10% | Quarterly earnings |
| Solar Silver Demand | 120-125 Moz forecast 2026 | Exceeds 130 Moz | Falls below 100 Moz | Silver Institute |
Decision Framework
| Stock | Buy | Add | Reduce | Stop |
|---|---|---|---|---|
| NEM | $85 | $92 | $130 | $72 |
| AEM | $160 | $170 | $220 | $140 |
| KGC | $22 | $25 | $35 | $18 |
| WPM | $100 | $110 | $145 | $85 |
| GOLD | $32 | $35 | $50 | $27 |
| PAAS | $40 | $44 | $60 | $34 |
| FNV | $210 | $235 | $280 | $185 |
| RGLD | $195 | $215 | $260 | $170 |
| AG | $14 | $17 | $25 | $11 |
| HL | $13 | $16 | $25 | $10 |
Framework logic: - Buy: 10-15% below current price — correction entry - Add: Near current price — confirms thesis on pullback - Reduce: 30-40% above current price — take profits, rebalance - Stop: 25-30% below current price — thesis invalidation, protect capital
Part 3 of “The Geopolitical Edge” series. Part 1: LNG Value Chain | Part 2: Defense/Munitions Super-Cycle available on the blog.
Disclaimer: Research and educational purposes only. Not investment advice. Data as of March 22, 2026. Gold ~$4,520/oz, Silver ~$72/oz. All fundamental data sourced from company filings, StockAnalysis, Yahoo Finance, GuruFocus, Alpha Spread, MarketBeat, World Gold Council, and Silver Institute.