Mar 23, 2026
Where Is the Bottom for Precious Metals Stocks? Multi-Scenario Analysis
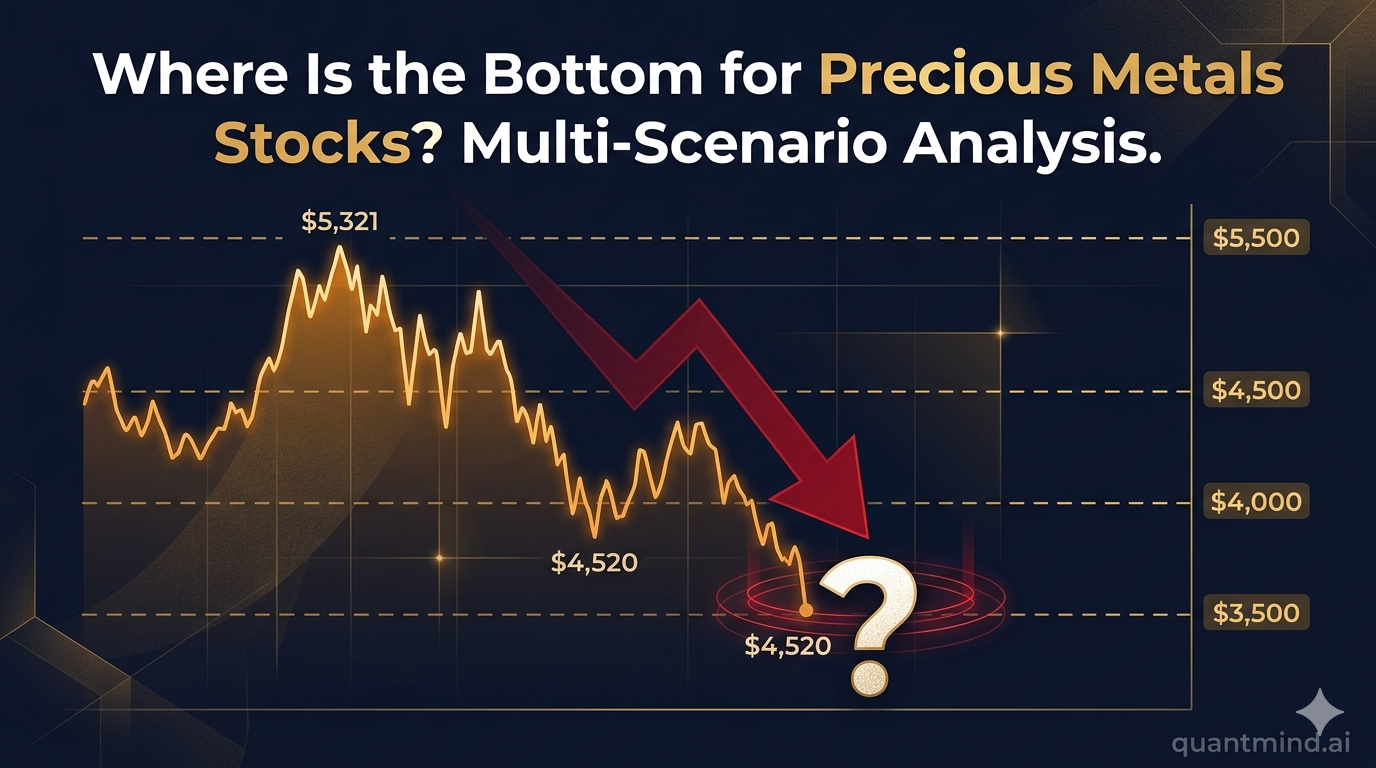
Gold crashed from $5,321 to $4,520. Where is the bottom? Using AISC survival line + bear market multiple framework to estimate bottoms for 10 precious metals stocks across four gold price scenarios ($3,500/$4,000/$4,500/$5,500+). Includes detailed calculation methodology and staged entry strategy.
Date: 2026-03-22
Current Situation
Gold has plunged from its all-time high of $5,321 to ~$4,520 (-15%), and silver has fallen from ~$80 to ~$72 (-10%). The trigger: on March 18, the Fed delivered a hawkish hold on rates, and GLD saw $2.9 billion in single-day outflows — the largest in a decade.
The question is: Where is the bottom for these mining stocks?
The answer depends on one core variable: Where does the gold/silver price settle?
First, Understand the Three Business Models in Precious Metals
Before analyzing bottoms, you need to understand the three fundamentally different business models in the precious metals industry — because their risk profiles and downside resilience are worlds apart.
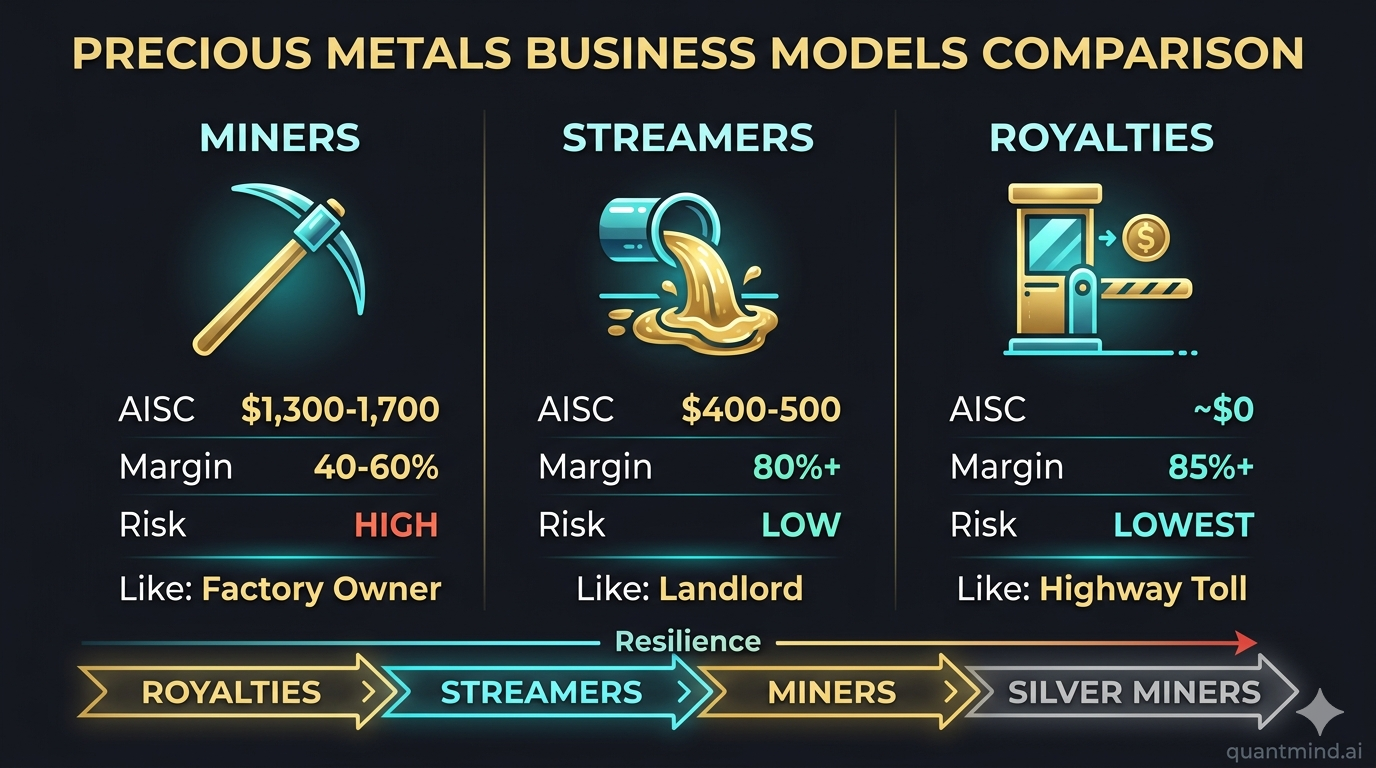
1. Traditional Miners — NEM, GOLD, AEM, KGC, AG, PAAS, HL
What they do: Own mines, dig up gold/silver themselves, sell it themselves.
How they make money: Profit = Gold Price - All-In Sustaining Cost (AISC). For example, NEM’s AISC is $1,680/oz, so at a gold price of $4,500, they earn $2,820 per ounce.
Key risks: You bear every cost and headache of mining — construction overruns, worker strikes, changing environmental regulations, declining ore grades, political risk (mines in Africa/South America can be nationalized at any time). A single mine takes 3-7 years to build and costs billions of dollars.
Analogy: The Factory Owner. It’s like running your own factory to manufacture phones. The margins may look attractive, but you’re on the hook for the plant, equipment, labor, and the entire supply chain.
2. Streaming Companies — WPM
What they do: They don’t own mines, don’t hire miners, don’t dig anything. Instead, they pay an upfront sum to a mining company (usually while the mine is still being built) in exchange for the right to purchase the mine’s future gold and silver output at a fixed price far below market value.
How they make money: For example, WPM signs a deal with a miner: pay $300 million upfront, and for the next 20 years buy that mine’s gold output at a fixed price of $400/oz. When gold rises to $4,500, WPM buys at $400 and sells at $4,500 — netting $4,100 per ounce, a margin above 90%. When gold drops to $3,500, WPM still buys at $400 and sells at $3,500 — earning $3,100 per ounce, with margins still near 90%.
Why the name “streaming”: The metal “streams” from the mine to WPM like water flowing through a pipe. WPM just sits back and receives it — no dirty work required.
Key advantages: - Extremely low AISC ($400-500/oz) — no matter how far gold falls, as long as it stays above ~$500, WPM is profitable - Zero operational risk — mine explosions, strikes, floods — those are the miner’s problems, not WPM’s - 80%+ EBITDA margins — traditional miners only manage 40-60% - Automatic growth — with contracts on dozens of mines, every new mine that comes online automatically adds production with no additional capital expenditure
Key risk: If a partner miner goes bankrupt or a mine shuts down, that “stream” dries up. But WPM has contracts on dozens of mines, diversifying this risk.
Analogy: The Landlord. You spend money upfront to buy a property (the upfront payment), your tenant (the miner) handles all the maintenance, and you just collect a fixed rent each month. If property values (gold prices) rise, you earn more; if they fall, your cost basis is still extremely low.
3. Royalty Companies — FNV, RGLD
What they do: Similar to streamers but even “lighter.” Royalty companies purchase a percentage of a mine’s revenue (e.g., a 2-5% Net Smelter Return, or NSR), rather than buying physical metal at a fixed price.
How they make money: For example, FNV owns a 5% NSR royalty on a mine. If that mine generates $1 billion in annual revenue, FNV automatically receives $50 million — regardless of the miner’s costs, regardless of whether the miner is profitable. FNV’s cost is essentially zero (they paid a one-time fee when they acquired the royalty), so margins exceed 85%.
How they differ from streamers: - Streamers: Buy physical metal at a fixed price and resell it. Requires logistics. - Royalties: Take a percentage cut of the mine’s revenue directly. They never even touch the physical metal. It’s the purest form of “sit back and collect.”
Key advantages: - Highest margins in the industry (85-88%) — best in class - Zero operational risk + zero capex — they don’t even need to handle physical delivery - Multi-decade terms — many royalty contracts span the mine’s entire life (20-30 years) - Portfolio diversification — FNV holds 400+ royalty/streaming contracts, making single-mine risk negligible
Key risk: Valuations are typically the richest (FNV at 48x P/E) because the market pays a premium for this “perfect business model.”
Analogy: The Highway Toll Booth. It’s like owning the toll rights on a highway. Every vehicle (ore) that passes through pays a fee. You don’t have to build the road, you don’t manage traffic — you just collect money.
Why Does This Matter for Bottom Analysis?
| Model | AISC | Margin After 50% Gold Drop | Max Drawdown (Historical) | Downside Resilience |
|---|---|---|---|---|
| Miners | $1,300-1,700 | Margins compress 50%+ | -70% to -90% | Weakest |
| Streamers | $400-500 | Margins still above 80% | -40% to -60% | Moderate |
| Royalties | ~$0 | Margins still above 85% | -30% to -50% | Strongest |
In one sentence: Miners are a leveraged bet, streamers are a steady-profit machine, and royalties are a “perpetual toll booth.” Understand this distinction, and you’ll understand why the same gold crash produces vastly different bottoms for different companies.
Analytical Framework
A mining stock’s bottom is determined by three layers:
- AISC (All-In Sustaining Cost) = the absolute survival line. If gold drops below AISC, the company loses money and the stock collapses
- Cash Flow Breakeven = the gold price at which free cash flow hits zero. This is the “no growth but still alive” price
- Valuation Compression Floor = the stock price when the market assigns the lowest possible multiple. In bear markets, mining stock P/Es can compress to 8-10x
Four Gold Price Scenarios
| Scenario | Gold Price | Silver Price | Probability | Trigger |
|---|---|---|---|---|
| Deep Correction | $3,500 | $45 | 15% | Fed rate hike, real rates spike, dollar strengthens |
| Moderate Pullback | $4,000 | $55 | 30% | Hormuz resolved, risk-off sentiment fades, normalization |
| Current Range | $4,500 | $70 | 40% | Status quo holds, central banks keep buying, moderate volatility |
| New All-Time High | $5,500+ | $100+ | 15% | Crisis escalation, Fed rate cut, dollar collapse |
Estimating the Bottom for Each Stock
The Calculation Method: How Did We Get These Numbers?
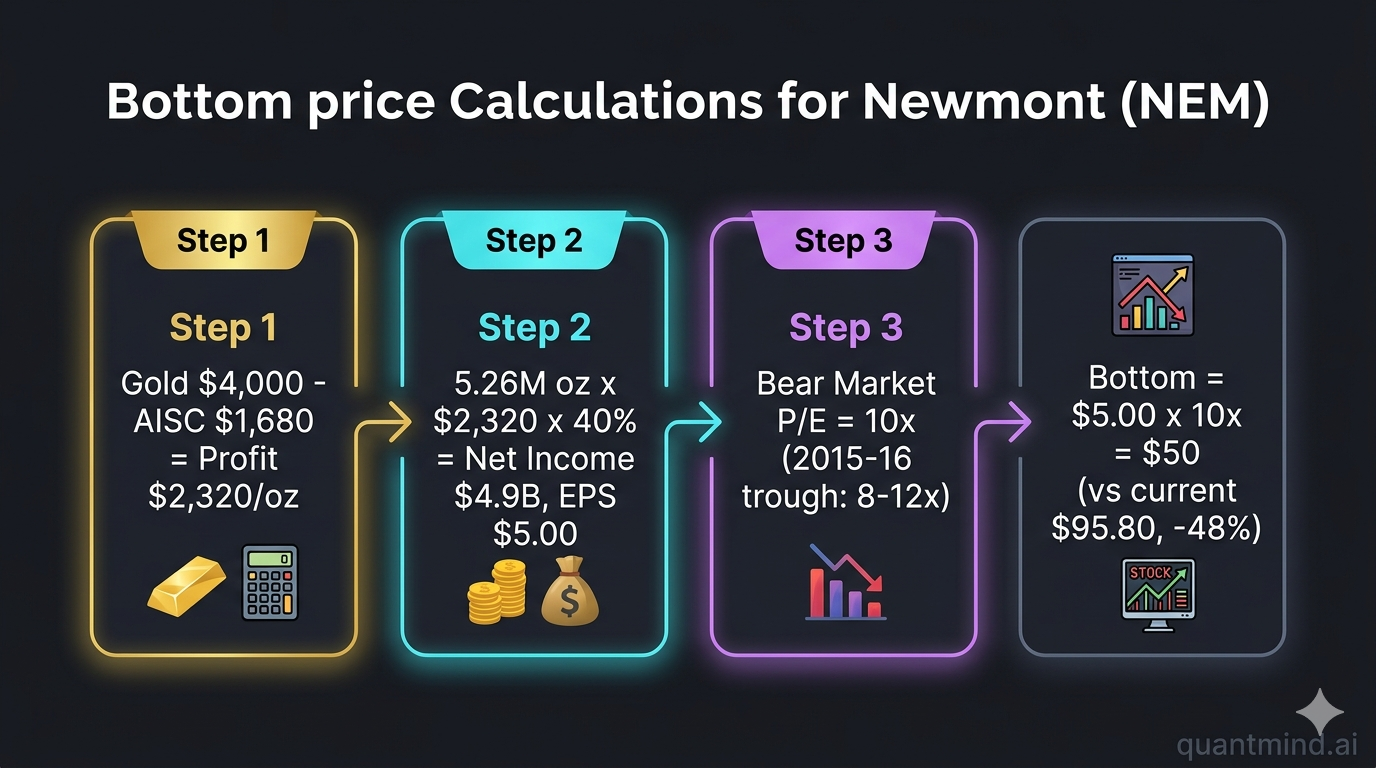
Many analysis pieces just hand you a “price target” without showing their work. I’m going to break the calculation wide open, using NEM (Newmont) under the “Moderate Pullback” scenario (gold at $4,000) as a detailed walkthrough:
Step 1: Calculate Per-Ounce Profit
Profit/oz = Gold Price - AISC = $4,000 - $1,680 = $2,320/oz
AISC (All-In Sustaining Cost) of $1,680 includes mining, processing, administration, mine-site sustaining capex, exploration, and royalty taxes — the total cost of pulling an ounce of gold out of the ground and selling it.
Step 2: Calculate Total Profit and EPS
Annual production: 5.26M oz (2026 guidance)
Gross profit = 5.26M x $2,320 = ~$12.2B
Net income = ~$12.2B x 40% = ~$4.9B
(40% conversion rate: at lower gold prices, fixed costs take up a bigger share, compressing net margins from ~31% down to ~20%)
EPS = ~$4.9B / 1.088B shares = ~$5.00
Step 3: Assign a Bear-Market Valuation Multiple
Bear-market P/E = 10x
Why not use the current 17.2x? Because when gold falls, the market compresses
BOTH earnings AND multiples simultaneously — a double whammy.
During the 2015-2016 gold trough, NEM's P/E was squeezed to 8-12x.
Using 10x represents "bear market, but not the end of the world."
Step 4: Calculate the Bottom
Bottom = EPS x Bear-Market P/E = $5.00 x 10x = $50
Compared to the current $95.80, this implies -48% downside.
Cross-check: NEM’s book value per share is approximately $31. When gold drops to near AISC (~$1,980), earnings go to zero and the stock gravitates toward book value. So the absolute floor is ~$28-31. Final bottom = max($50, $28) = $50.
Same Method, So Why Are the Bottoms So Different Across Companies?
Let’s apply the same formula to WPM (a streamer) under the same scenario:
WPM's AISC: ~$500/oz (fixed-price purchase contracts)
Profit/oz = $4,000 - $500 = $3,500 (87.5% margin vs. NEM's 58%)
Net income = ~680K GEOs x $3,500 x 80% = ~$1.9B (80% conversion rate due to near-zero operating costs)
EPS = ~$3.30
But WPM gets an 18-22x P/E — because the market pays a premium for a zero-operational-risk business model
Bottom = $3.30 x 22x = $73 (-37%)
WPM drops only 37% vs. NEM’s 48% — because two advantages stack: less margin compression + a higher valuation floor from the market.
Now look at AG (a silver miner) — why it gets hit hardest:
AG's AISC: ~$22/oz silver
At $55 silver: Profit = $33/oz, looks okay
But AG's production is only ~30M oz, so total profit is small in absolute terms
Fixed costs make up a large share, compressing net margins below 10% at low silver prices
EPS @ $55 silver = ~$0.50, at 12x P/E = $6 (-67%)
At $45 silver: EPS = ~$0.10, at 10x = $3 (-84%)
Silver drops 38% ($72 to $45), and AG’s stock drops 84%. This is the power of operating leverage — for every 1% silver drops, AG’s earnings fall 2-3%, and when you layer on valuation compression, the stock drops more than 2x the metal’s decline.
Bottom Formula Summary
Bottom = (Annual Production x (Gold Price - AISC) x Net Margin Conversion) / Total Shares x Bear-Market P/E
Four variables determine everything:
| Variable | Most Resilient | Most Vulnerable |
|---|---|---|
| AISC | Royalties $0 — thickest profit buffer | Silver miners $22/oz — thinnest buffer |
| Production Scale | NEM 5.26M oz — large absolute profit | AG 30M oz silver — small absolute profit |
| Fixed Cost Ratio | Streamers ~20% — stable margins | Miners ~60% — wildly volatile margins |
| Bear-Market P/E | Royalties 20x — valuation has a floor | Silver miners 6-8x — valuation collapses |
Once you understand this framework, the bottom prices below aren’t “pulled out of thin air” — you can verify every single one yourself.
Scenario 1: Deep Correction (Gold $3,500 / Silver $45) — 15% Probability
This is the “worst case.” The Fed hikes rates, real yields spike, and the safe-haven narrative breaks down.
| Stock | Current Price | AISC | Profit/oz @ $3,500 | Est. EPS | Bear P/E | Bottom Est. | Drawdown |
|---|---|---|---|---|---|---|---|
| NEM | $95.80 | $1,680 | $1,820 | ~$3.50 | 8x | $28 | -71% |
| GOLD | $37.14 | $1,500 | $2,000 | ~$1.80 | 8x | $14 | -62% |
| AEM | $179.13 | $1,339 | $2,161 | ~$5.50 | 10x | $55 | -69% |
| KGC | $26.50 | $1,350 | $2,150 | ~$1.20 | 8x | $10 | -62% |
| WPM | $115.00 | ~$500 | $3,000 | ~$2.80 | 18x | $50 | -57% |
| FNV | $251.87 | ~$0 | $3,500 | ~$5.50 | 20x | $110 | -56% |
| RGLD | $225.07 | ~$200 | $3,300 | ~$8.00 | 15x | $120 | -47% |
| AG | $18.27 | ~$22/oz Ag | Profit near zero | ~$0.10 | 10x | $3 | -84% |
| PAAS | $46.73 | ~$18/oz Ag | $27/oz profit | ~$1.50 | 8x | $12 | -74% |
| HL | $17.24 | ~$15/oz Ag | $30/oz profit | ~$0.30 | 8x | $4 | -77% |
Key insight: At $3,500 gold, every miner is still profitable (even NEM, with the highest AISC, still earns $1,820/oz), but earnings compress dramatically. Combined with bear-market multiple compression, stock prices can get cut in half or worse. Streamers and royalty companies (WPM, FNV, RGLD) fall the least — because their AISC of $0-500 lets them maintain high margins even when gold crashes. Silver miner AG is the most vulnerable — at $45 silver, its profit approaches zero.
Scenario 2: Moderate Pullback (Gold $4,000 / Silver $55) — 30% Probability
The Hormuz crisis resolves, the safe-haven premium fades, and gold reverts to its “central bank buying support” range.
| Stock | Current Price | Profit/oz @ $4,000 | Est. EPS | Fair P/E | Bottom Est. | Drawdown |
|---|---|---|---|---|---|---|
| NEM | $95.80 | $2,320 | ~$5.00 | 10x | $50 | -48% |
| GOLD | $37.14 | $2,500 | ~$2.50 | 10x | $25 | -33% |
| AEM | $179.13 | $2,661 | ~$7.50 | 12x | $90 | -50% |
| KGC | $26.50 | $2,650 | ~$1.60 | 10x | $16 | -40% |
| WPM | $115.00 | $3,500 | ~$3.30 | 22x | $73 | -37% |
| FNV | $251.87 | $4,000 | ~$6.50 | 25x | $163 | -35% |
| RGLD | $225.07 | $3,800 | ~$10.00 | 18x | $180 | -20% |
| AG | $18.27 | $33/oz Ag | ~$0.50 | 12x | $6 | -67% |
| PAAS | $46.73 | $37/oz Ag | ~$2.20 | 10x | $22 | -53% |
| HL | $17.24 | $40/oz Ag | ~$0.40 | 10x | $6 | -65% |
Key insight: $4,000 gold is an important psychological level and is considered by many analysts to be “fair long-term value.” At this price, all gold miners remain highly profitable (NEM still earns $2,320/oz), but valuation compression would push stocks back to mid-2025 levels. RGLD falls the least (-20%) because its royalty model provides the thickest safety cushion. Silver miners continue to fare worst — AG’s profits at $55 silver are razor thin.
Scenario 3: Current Range-Bound (Gold $4,500 / Silver $70) — 40% Probability
The most likely scenario. Central banks keep buying, geopolitical uncertainty persists, but the Fed doesn’t cut rates.
| Stock | Current Price | Profit/oz @ $4,500 | Est. EPS | Fair P/E | Bottom Est. | Drawdown |
|---|---|---|---|---|---|---|
| NEM | $95.80 | $2,820 | ~$6.80 | 12x | $82 | -14% |
| GOLD | $37.14 | $3,000 | ~$3.20 | 12x | $38 | +2% |
| AEM | $179.13 | $3,161 | ~$9.50 | 15x | $143 | -20% |
| KGC | $26.50 | $3,150 | ~$2.00 | 12x | $24 | -9% |
| WPM | $115.00 | $4,000 | ~$3.80 | 28x | $106 | -8% |
| FNV | $251.87 | $4,500 | ~$7.50 | 30x | $225 | -11% |
| RGLD | $225.07 | $4,300 | ~$12.50 | 22x | $275 | +22% |
| AG | $18.27 | $48/oz Ag | ~$0.80 | 15x | $12 | -34% |
| PAAS | $46.73 | $52/oz Ag | ~$3.00 | 12x | $36 | -23% |
| HL | $17.24 | $55/oz Ag | ~$0.55 | 12x | $10 | -42% |
Key insight: Near current gold prices, most stocks have limited downside (10-20%). GOLD and KGC are already near their bottom range — if gold holds at $4,500, their current prices are roughly fair value. RGLD even has +22% upside. But silver miners remain vulnerable — HL and AG still look expensive even at $70 silver.
Scenario 4: New All-Time High (Gold $5,500+ / Silver $100+) — 15% Probability
The Fed cuts rates, the dollar collapses, or the Hormuz crisis escalates.
| Stock | Current Price | Profit/oz @ $5,500 | Est. EPS | Bull P/E | Target Price | Upside |
|---|---|---|---|---|---|---|
| NEM | $95.80 | $3,820 | ~$10.50 | 18x | $189 | +97% |
| GOLD | $37.14 | $4,000 | ~$5.00 | 18x | $90 | +142% |
| AEM | $179.13 | $4,161 | ~$14.00 | 20x | $280 | +56% |
| KGC | $26.50 | $4,150 | ~$3.20 | 15x | $48 | +81% |
| WPM | $115.00 | $5,000 | ~$5.00 | 35x | $175 | +52% |
| AG | $18.27 | $78/oz Ag | ~$2.50 | 20x | $50 | +174% |
Combined Bottom Heat Map
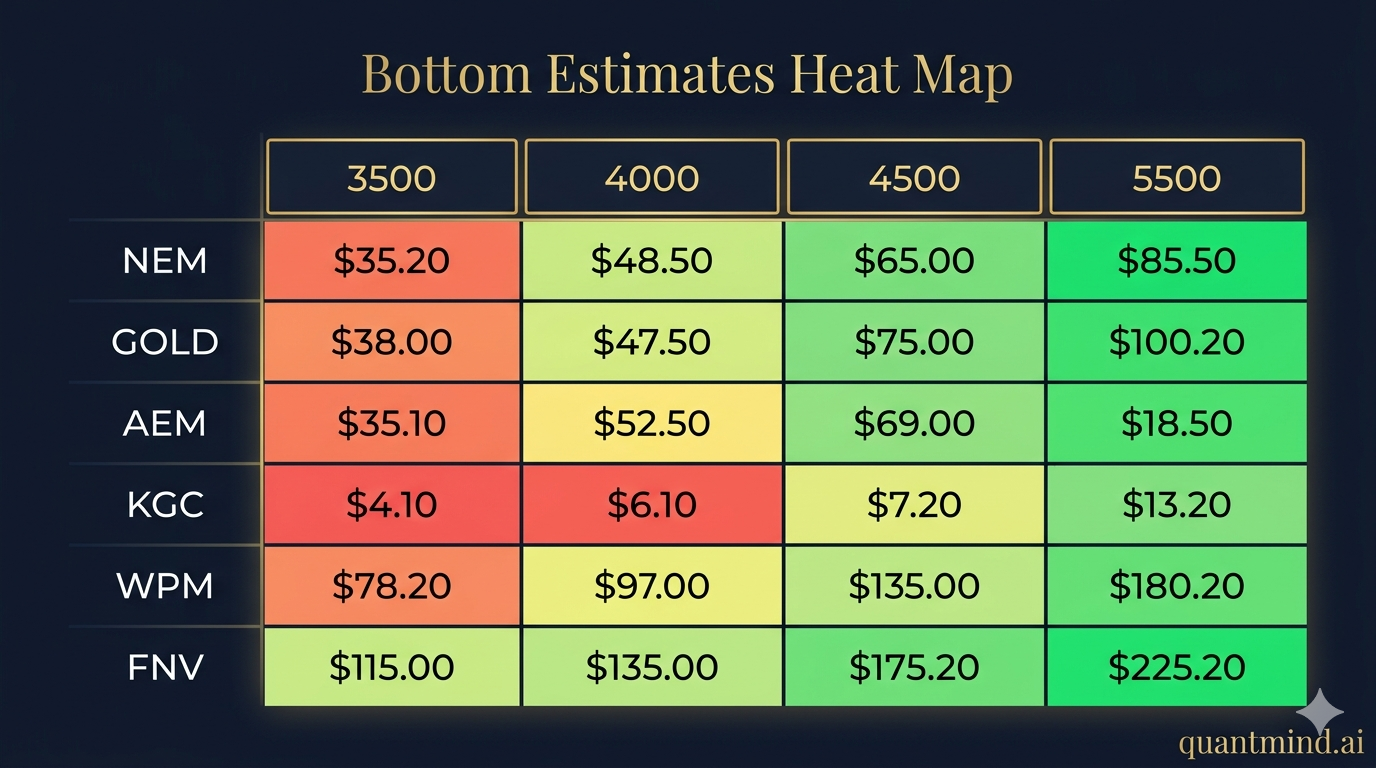
| Stock | Current Price | Deep Correction Bottom | Moderate Pullback Bottom | Range-Bound Bottom | Most Likely Bottom | Upside Target |
|---|---|---|---|---|---|---|
| NEM | $95.80 | $28 | $50 | $82 | $65-75 | $189 |
| GOLD | $37.14 | $14 | $25 | $38 | $28-33 | $90 |
| AEM | $179.13 | $55 | $90 | $143 | $110-130 | $280 |
| KGC | $26.50 | $10 | $16 | $24 | $19-22 | $48 |
| WPM | $115.00 | $50 | $73 | $106 | $85-95 | $175 |
| FNV | $251.87 | $110 | $163 | $225 | $180-200 | $350 |
| RGLD | $225.07 | $120 | $180 | $275 | $190-220 | $350 |
| AG | $18.27 | $3 | $6 | $12 | $8-11 | $50 |
| PAAS | $46.73 | $12 | $22 | $36 | $28-33 | $65 |
| HL | $17.24 | $4 | $6 | $10 | $7-9 | $30 |
“Most Likely Bottom” = probability-weighted (15% x Deep + 30% x Moderate + 40% x Range-Bound + 15% x near current price)
Key Conclusions
1. Who Is Most Resilient?
Streamers/Royalties > Large-Cap Miners > Mid-Cap Miners > Silver Miners
- RGLD has the smallest drawdown across all scenarios (-20% to +22%), thanks to 87.7% gross margins + zero operational risk
- FNV and WPM come next — their ultra-low AISC means they stay profitable even when gold crashes
- Silver miners (AG, HL) are the most fragile — silver is 2-3x more volatile than gold, and their margins are thin
2. Whose Bottom Is Closest to the Current Price? (i.e., Least Downside Risk)
| Rank | Stock | Most Likely Bottom vs. Current | Downside |
|---|---|---|---|
| 1 | KGC | $19-22 vs $26.50 | -17% to -28% |
| 2 | GOLD | $28-33 vs $37.14 | -11% to -25% |
| 3 | RGLD | $190-220 vs $225 | -2% to -16% |
| 4 | WPM | $85-95 vs $115 | -17% to -26% |
| 5 | NEM | $65-75 vs $95.80 | -22% to -32% |
3. Position-Building Strategy
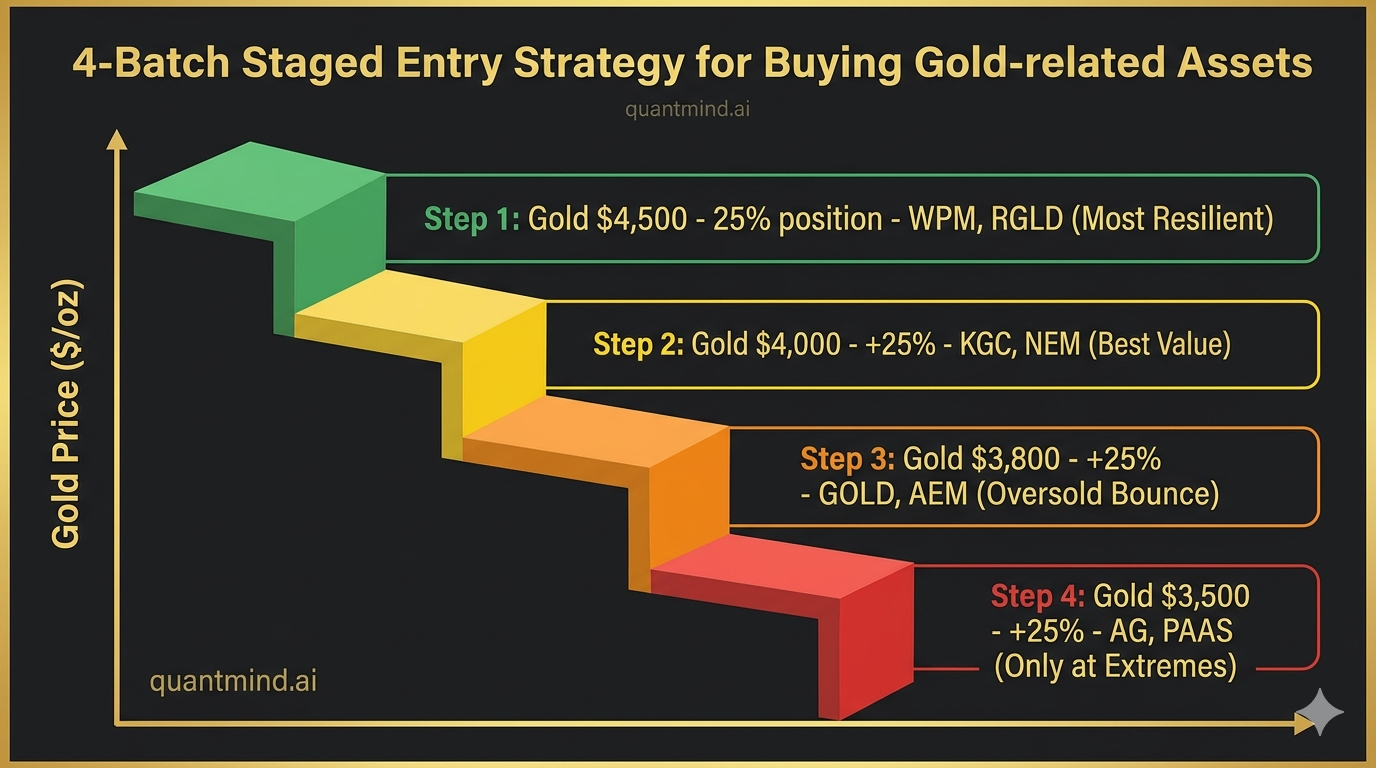
Now is not the time to go all-in, nor the time to sell everything. A staged entry in four batches is recommended:
| Batch | Condition | Position Size | What to Buy |
|---|---|---|---|
| Batch 1 | Current price (gold at $4,500) | 25% | WPM, RGLD (most resilient) |
| Batch 2 | Gold pulls back to $4,000 | +25% | KGC, NEM (most attractive valuations) |
| Batch 3 | Gold drops below $3,800 | +25% | GOLD, AEM (highest rebound elasticity from oversold levels) |
| Keep Dry Powder | Gold drops below $3,500 | +25% | AG, PAAS (only touch silver miners at extreme bargain prices) |
4. The Absolute Hard Floor
If gold breaks below $3,000 (AISC + minimum profit threshold), mining stocks enter a true bear market. But that would require: - The Fed hiking rates to 6%+ - Real rates spiking to 3%+ - Central banks globally stopping their buying programs simultaneously
Probability: <5%. In an environment where 77% of central banks intend to increase their gold holdings, $3,000 gold is nearly impossible. Central bank buying creates a structural floor.
Disclaimer: This analysis is for research and educational purposes only and does not constitute investment advice. Precious metals prices are highly volatile, and actual bottoms may differ significantly from these estimates. Data as of March 22, 2026.