Mar 28, 2026
The HBM Supercycle: Why Memory Is No Longer a Commodity — and Which Stocks Own the Bottleneck
HBM supercycle, DRAM/NAND pricing recovery, AI memory bottleneck. 10 stocks analyzed. Updated March 28 with Google TurboQuant analysis.
Part 3 of “The Geopolitical Edge” Investment Series
I always thought memory was the most boring corner of semiconductors. Cyclical stocks, three oligopolists taking turns slashing prices, margins riding the DRAM roller coaster, and anyone who bought at the top getting buried. Why bother?
Then I ran the numbers.
A single NVIDIA B300 GPU requires $5,000-8,000 in memory alone. 288GB of HBM at $30-45 per gigabyte. One GB300 NVL72 rack packs 72 GPUs and nearly 20TB of HBM — memory costs alone exceed $500,000. A 100,000-GPU training cluster? The memory bill tops $500 million.
Five years ago, a server’s memory cost less than $500.
Standard DDR5? $3-5 per gigabyte. HBM is 10x more expensive. Only three companies on Earth can make it. And each gigabyte of HBM consumes roughly 3x the wafer capacity of DDR5 — directly starving conventional memory of supply.
The result: DRAM contract prices surged 90-95% quarter-over-quarter in Q1 2026. NAND followed at +55-60% QoQ. SanDisk is doubling enterprise SSD prices. IDC issued a “global memory shortage crisis” warning. Bank of America calls it “a supercycle similar to the boom of the 1990s.”
Memory has become the most critical bottleneck of the AI era. I never saw that coming.
You might be thinking: Memory stocks at 7x P/E, 8/8 earnings beats, sounds too good — and then you remember 2018. That year MU was also beating estimates every quarter, analysts were unanimously bullish, and then DRAM prices collapsed and MU fell from $64 to $28. You swore you’d never touch cyclicals again.
I get that fear. But I’ll explain in this piece why the structure this time is fundamentally different from 2018 — and if I’m wrong, where your stop-loss should be.
I spent two days running full fundamental analysis on 10 stocks spanning the memory value chain — chip makers, equipment suppliers, storage systems, and AI infrastructure — across valuation, financial health, earnings quality, peer comparisons, and intrinsic value. Here’s the complete breakdown.
TL;DR: - Top Conviction: MU (Micron) — fwd P/E 7.6x, PEG 0.26, 8/8 beats with +31% blowout, $4.6B net cash, #2 HBM manufacturer globally - Best Value Play: DELL — fwd P/E 12.1x, 40% revenue growth, #1 AI server OEM, PEG 0.65 - Best Execution: AMAT/LRCX/KLAC — all 8/8 perfect beat streaks, structural WFE growth, memory capex re-accelerating - Best Growth Play: MRVL — custom AI silicon inflection, PEG 1.01, multi-metric undervaluation - Most Dangerous: STX — D/E 9.80x, Altman Z near distress, but nearline HDD pricing power is real - Avoid for Now: ASML — 2 misses in 4 quarters, PEG 2.16, only 13% analyst upside despite EUV monopoly
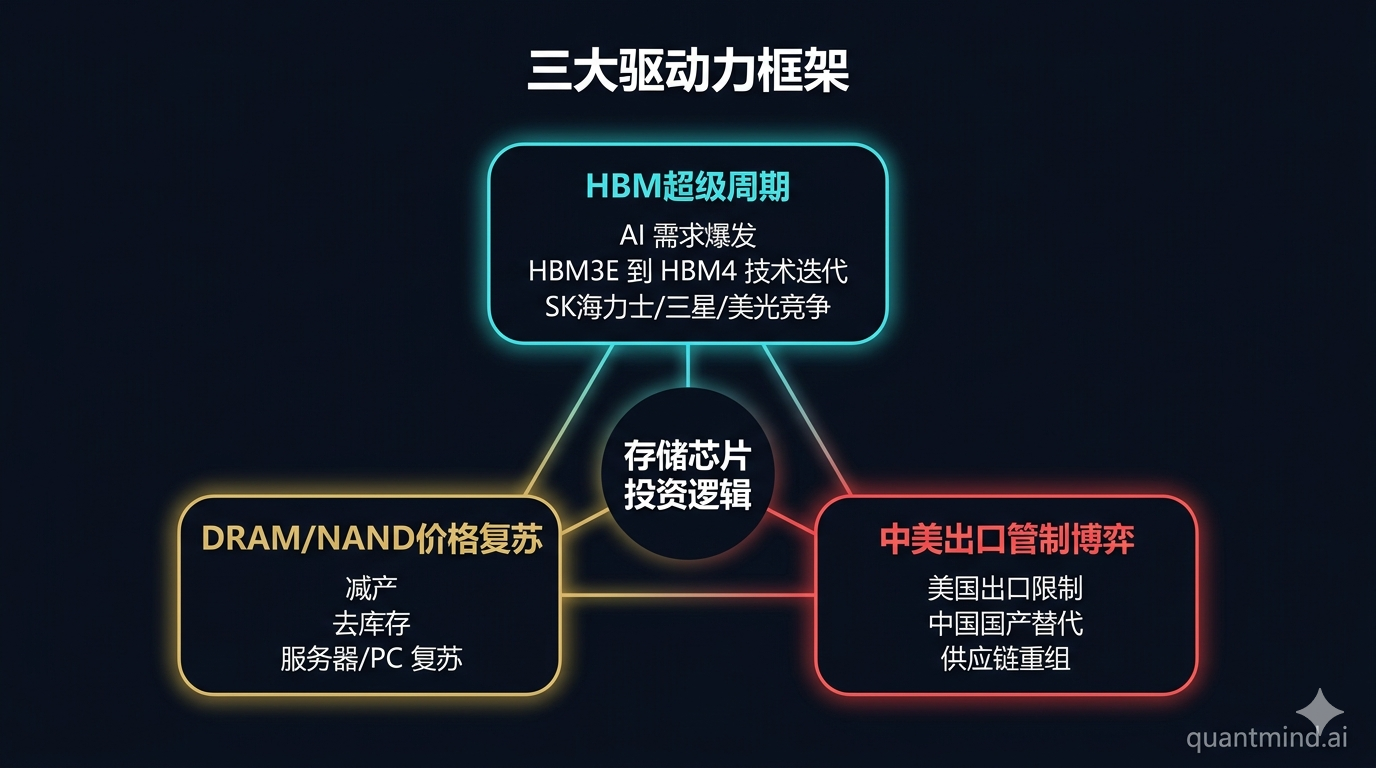
Three Forces Driving the Memory Supercycle
Force 1: HBM Supercycle — AI’s Memory Bottleneck
Memory bandwidth is the critical bottleneck for AI training and inference. Each GPU generation demands exponentially more memory:
| GPU | HBM Capacity | Bandwidth | HBM Type |
|---|---|---|---|
| H100 | 80 GB | 3.35 TB/s | HBM3 |
| H200 | 141 GB | 4.8 TB/s | HBM3e |
| B200 | 192 GB | 8 TB/s | HBM3e |
| B300 | 288 GB | 8 TB/s | HBM3e (12-high) |
| Vera Rubin (H2 2026) | 288 GB | 13 TB/s | HBM4 |
The 2026 HBM market: $54.6 billion (+58% YoY). SK Hynix holds 53% share, Samsung 35%, Micron 11%. SK Hynix and Samsung raised HBM3e contract prices by 20% mid-cycle — an unusual move driven by sustained demand from NVIDIA and hyperscaler ASICs.
Supply is “essentially sold out” for 2026, per SK Hynix’s October 2025 earnings call. Samsung is expanding HBM production capacity by 50%. SK Hynix announced infrastructure investment increases of more than 4x previously announced figures. DRAM operating margins have reached the 60% range — record territory.
Force 2: DRAM/NAND Pricing Recovery — The Crowding-Out Effect
HBM’s 3x wafer consumption creates a structural crowding-out effect. As manufacturers prioritize HBM and server DDR5 for their superior margins, consumer and mobile DRAM gets squeezed — explaining the across-the-board price surge:
- DRAM contract prices: +90-95% QoQ in Q1 2026, with double-digit QoQ increases expected every quarter of 2026
- NAND flash: +55-60% QoQ in Q1 2026, with another +20% expected in Q2
- Enterprise SSDs: SanDisk doubling 3D NAND prices for enterprise, with enterprise NAND potentially rising 100%+ QoQ
- DDR5 vs DDR4 premium: Vanished — both now trade at roughly equivalent prices
- Inventory levels: 2-3 weeks for DRAM, 3-4 weeks for NAND — historically lean
- Nearline HDD: Seagate fully booked through 2026, lead times stretching to 52+ weeks
IDC has flagged a “global memory shortage crisis” with material impact on smartphone and PC markets throughout 2026. This isn’t a normal upcycle — it’s a structural supply deficit.
Why This Time Is Different from 2018: The Math of the Memory Cycle Has Changed
This is the most important section in this entire piece. If you understand this, everything else is a corollary.
The old memory cycle (the 2016-2018 variety): Prices rise –> all three players expand capacity –> 18 months later, oversupply –> prices crash –> losses –> production cuts –> start over
The HBM cycle (fundamentally different): 1. Expansion takes 3 years, not 18 months. Advanced packaging lines (TSV, hybrid bonding) take 36 months from project approval to volume production. You can’t accelerate this by buying a few more lithography tools. 2. HBM capacity can’t easily convert back to standard DRAM. TSV packaging lines are purpose-built, with billions of dollars sunk in. Unlike legacy DRAM, where capacity could flex between products, these lines are locked in. 3. The customers are NVIDIA/AMD/Google, not PC OEMs. Pricing power sits with the supply side, not the demand side. NVIDIA doesn’t squeeze you on price the way Lenovo did when buying DDR4. 4. Each GPU generation doubles memory content. H100 –> 80GB, B200 –> 192GB, B300 –> 288GB. Demand growth is outpacing supply growth.
Bottom line: HBM has transformed memory from an “18-month cycle” into a “3-5 year structural shortage.”
This is why MU at 7.6x forward P/E may not be “cheap at the cycle top” — it may be “the market still pricing a new reality with old cycle models.”
Force 3: China Memory Ambitions vs US Export Controls
China’s memory industry is advancing under sanctions — but faces fundamental constraints:
- CXMT (DRAM): Unveiled DDR5-8000 and LPDDR5X-10667 products. Holds 4.9% of global DRAM vs the Big Three’s 93.4%. Plans domestic HBM3 production by year-end 2026 — the most strategically significant development to watch.
- YMTC (NAND): On the Entity List since 2022. Aims for 15% NAND market share by late 2026. Building a trial production line using exclusively Chinese fab tools.
- The constraint: China cannot access EUV lithography. This caps DRAM at older nodes and makes advanced HBM manufacturing exceedingly difficult. US export controls apply to HBM made by US and overseas manufacturers.
- Equipment impact: ~25-30% of AMAT/LRCX/KLAC revenue historically from China. ASML’s EUV is completely banned for export. This creates a ceiling on addressable market growth for WFE companies.
The paradox: China’s attempt to build indigenous memory capacity will drive incremental equipment demand (for mature nodes) while simultaneously creating a long-term competitive threat if sanctions loosen.
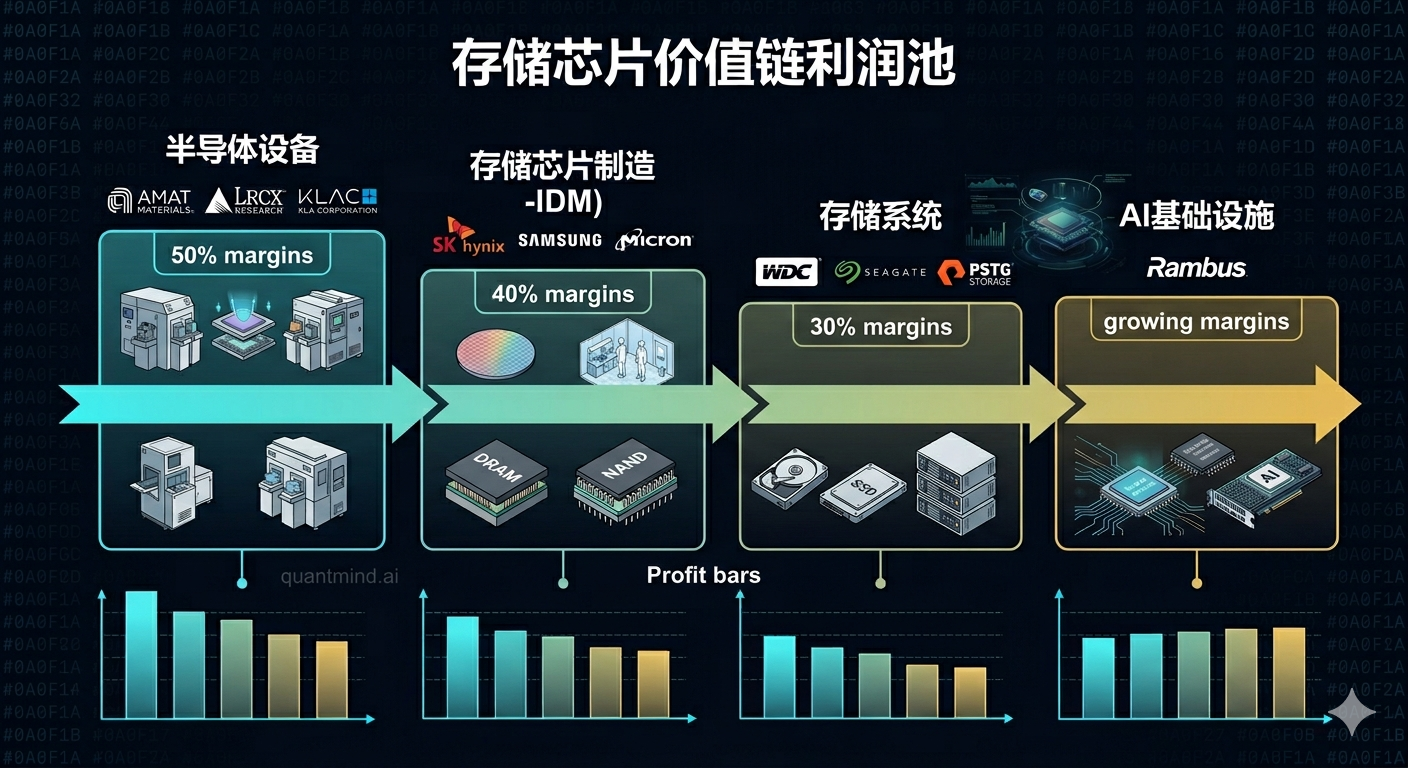
Where the Money Is: Memory & Storage Value Chain
| Segment | Margin Profile | Key Players | AI/HBM Catalyst |
|---|---|---|---|
| HBM/DRAM Manufacturing | Highest margin (60%+ op margin) | MU (US), SK Hynix, Samsung | VERY HIGH — direct HBM production, pricing power |
| NAND/SSD Manufacturing | Recovering (30-40% gross) | WDC, SanDisk, Kioxia | MODERATE — enterprise SSD demand from AI storage |
| HDD Storage | Moderate, nearline-led | STX, Toshiba | MODERATE — AI training data cold storage tier |
| Semiconductor Equipment | High margin (35-41% op) | AMAT, LRCX, KLAC, ASML | HIGH — memory capex re-acceleration, HBM tooling |
| Flash Storage Platforms | SaaS-like (70%+ gross) | PSTG | MODERATE — AI workload storage arrays |
| Custom Silicon/Controllers | Moderate (51% gross), growing | MRVL | HIGH — custom AI ASICs, storage controllers, networking |
| AI Server Infrastructure | Low margin (20% gross), high volume | DELL | HIGH — #1 AI server OEM, 40% revenue growth |
The Power Ranking: 10 Memory & Storage Stocks Analyzed
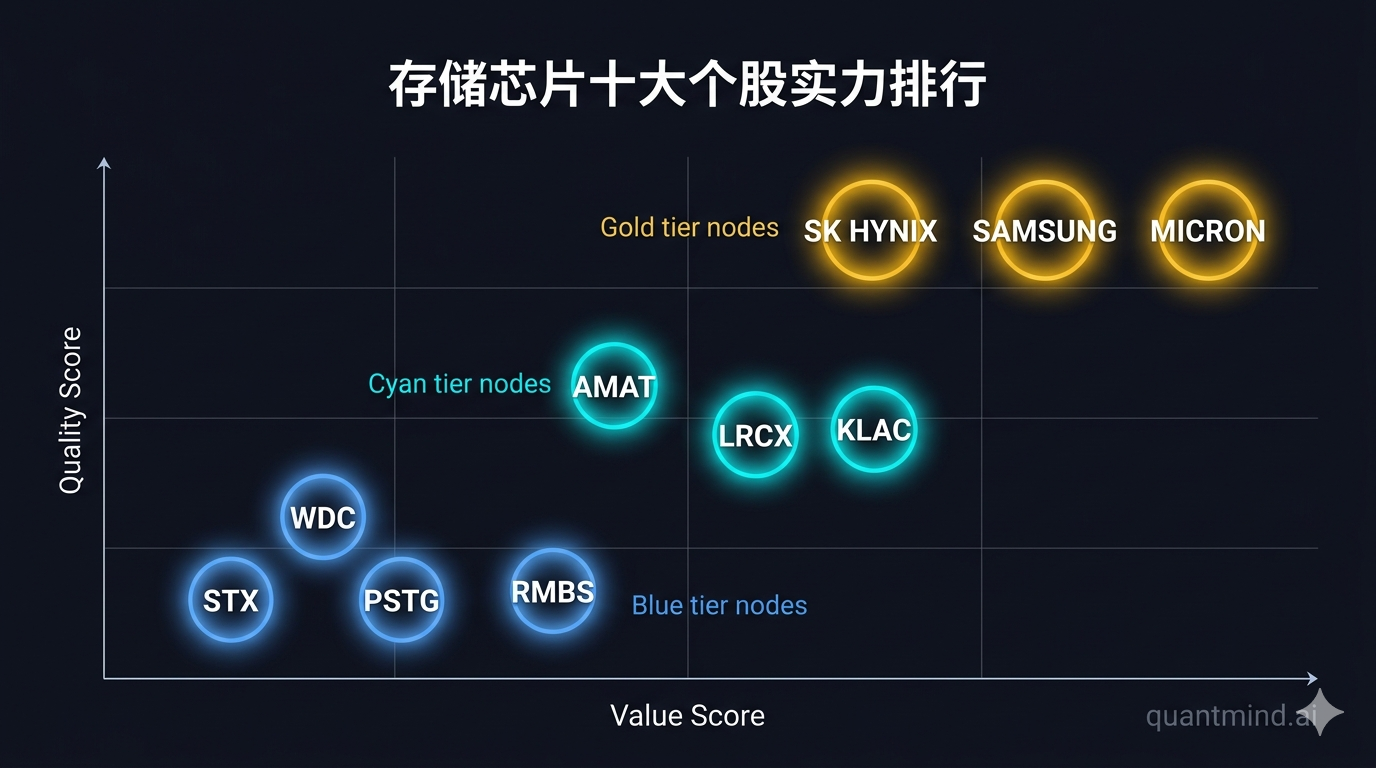
Tier 1: Core Holdings
MU — Micron Technology | $357.22 | Market Cap: $402.8B
The HBM King
| Metric | Value | Signal |
|---|---|---|
| P/E (Forward) | 7.6x | Deep value territory |
| PEG Ratio | 0.26 | Extreme growth discount |
| ROE | 39.8% | Excellent |
| Gross Margin | 58.4% | Near all-time highs on HBM mix |
| Operating Margin | 67.6% | Extraordinary — HBM pricing power |
| Beat Rate | 100% (8/8) | Perfect streak |
| Surprise Trend | Improving — FQ2 2026 blowout +31.0% | Analysts far behind |
| Net Cash | $4.6B | Fortress — $12.5B cash vs $7.9B debt |
| Debt/Equity | 0.11x | Near-zero leverage |
| Analyst Target | $527.60 (43 analysts) | +48% upside |
Bull case: Only US-listed pure-play memory manufacturer. #2 HBM supplier globally behind SK Hynix, with growing NVIDIA allocation. HBM revenue tripled QoQ in FQ2 2026. Forward P/E of 7.6x is absurdly cheap if HBM demand sustains through 2027. Idaho fab ($15B) gives long-term capacity. Net cash balance sheet. 8/8 beats with +31% blowout on FQ2 2026 ($12.20 actual vs $9.31 estimate).
Bear case: Memory is inherently cyclical — current 67.6% operating margins are unsustainable at cycle peak. HBM pricing will erode as Samsung scales up. Non-HBM DRAM/NAND could face oversupply in H2 2026. Revenue growth normalizes from +196% to single digits. P/E will expand as EPS declines off peak.
HBM edge: Micron is the only US company manufacturing HBM. At $15-18/GB for HBM3e vs $2.50-3.00/GB for DDR5, each GB of HBM carries 5-6x the revenue. HBM is now ~25-30% of DRAM revenue and rising rapidly. The B300’s 288GB per GPU means each GPU consumes ~$5,000-8,000 of HBM alone.
Action: BUY. Highest conviction in the memory sector. Peak-cycle risk is real but forward P/E of 7.6x already discounts significant earnings normalization.
DELL — Dell Technologies | $171.84 | Market Cap: $116.0B
The AI Server Toll Booth
| Metric | Value | Signal |
|---|---|---|
| P/E (Forward) | 12.1x | Cheapest in peer group |
| PEG Ratio | 0.65 | Very attractive |
| Revenue Growth | +40% YoY | Fastest in universe |
| Gross Margin | 20.1% | Low — hardware-centric |
| Beat Rate | 87.5% (7/8) | Strong |
| Surprise Trend | Improving — Q4 FY2026 +10.8% | Accelerating |
| Dividend Yield | 1.19% | Highest in group |
| Analyst Target | $170.57 (26 analysts) | -1% (consensus = current) |
Bull case: #1 AI server OEM with 40% revenue growth. Forward P/E of 12.1x is the cheapest stock in the group while growing the fastest. PEG of 0.65 is the second most attractive after MU. AI server backlog reportedly $4B+. NVIDIA’s #1 server partner. ISG (servers/storage) is the growth engine at 50-55% of revenue.
Bear case: Negative book value and current ratio below 1.0 are balance sheet concerns (structural from LBO-era debt/buybacks, not operational distress). 20% gross margins are thin — Dell captures volume but not margin from AI. Analyst consensus at current price suggests limited upside. Competition from HPE, Lenovo, Supermicro in AI servers.
The PEG divergence: Analyst consensus says fully valued (-1%), but PEG-adjusted fair value implies +54% upside. This gap suggests analysts are discounting Dell’s AI server growth sustainability. If AI capex persists through 2027, targets will need to be raised.
Action: BUY. Best risk/reward in AI infrastructure. Low expectations + high growth = asymmetric setup.
Tier 2: Strategic Positions
MRVL — Marvell Technology | $94.88 | Market Cap: $83.0B — The Custom Silicon Play
Custom AI chips for hyperscalers (Amazon Trainium, Google TPU networking). Storage controllers + PAM4 optics DSPs + custom ASICs = diversified AI data center play. Forward P/E 22.9x, PEG 1.01, 27% analyst upside. Q3 FY2026 was a massive +60.6% beat on custom silicon ramp, then Q4 normalized. BUY — custom AI silicon TAM is $20B+ by 2028.
PSTG — Pure Storage | $58.96 | Market Cap: $19.5B — The Flash Storage Compounder
Only pure-play all-flash enterprise storage company. 70.6% gross margins rival SaaS companies. Subscription model with 45% services revenue and 20%+ ARR growth. Zero debt. NVIDIA DGX SuperPOD storage partner. 55% analyst upside (highest in group). But trailing P/E of 107x and narrowing beat surprises. BUY on dips — subscription model undervalued.
AMAT — Applied Materials | $337.17 | Market Cap: $267.6B — The WFE Workhorse
Largest and most diversified WFE company. Perfect 8/8 earnings execution with remarkably consistent 3-6% surprise magnitude. HBM hybrid bonding technology moat. ~40% of revenue tied to memory spending. 22% analyst upside. But revenue flat YoY (-2%) and PEG of 1.61 is not cheap. HOLD/ACCUMULATE — reliable execution, fairly valued.
Tier 3: Growth / Tactical
LRCX — Lam Research | $211.41 | Market Cap: $264.0B — The 3D NAND Etch Leader
Etch leader with structural content growth — each generation of 3D NAND (128L to 232L to 300L+) increases etch steps. Perfect 8/8 beat streak. Fastest revenue growth among WFE peers (+22%). Critical etch tools for HBM through-silicon vias (TSVs). But most expensive WFE stock on EV/EBITDA (37.4x) and PEG of 1.64. HOLD — structural growth story, rich valuation.
KLAC — KLA Corporation | $1,443.21 | Market Cap: $189.6B — The Inspection Monopoly
Near-monopoly in process control and metrology with 55%+ market share. Best margins in WFE: 61.6% gross, 41.3% operating. Perfect 8/8 beat streak, but surprise declining to just +0.6% — street has nearly caught up. Lower China risk than deposition/etch peers. HOLD — monopoly premium deserved, but miss risk rising.
WDC — Western Digital | $275.34 | Market Cap: $93.4B — The NAND Recovery Play
Post-SanDisk split, WDC is a pure enterprise flash/SSD play. PEG of 0.69 is attractive. 4 consecutive beats with stable 10-22% surprise range. But no HBM exposure — missing the highest-margin memory opportunity. Short-term debt of $2.2B needs refinancing. Borderline Altman Z-score. HOLD — NAND recovery play but inferior to MU.
Tier 4: Proceed with Caution
STX — Seagate Technology | $380.07 | Market Cap: $82.9B — The Nearline HDD Monopoly
Nearline HDD pricing power from AI data storage demand is real — fully booked through 2026, 52-week lead times. PEG of 0.64 is attractive. Highest dividend yield in group (0.77%). But D/E of 9.80x is a red flag. Negative retained earnings (-$7.4B). Altman Z-score near distress (~1.5). TACTICAL ONLY — balance sheet disqualifies large positions.
ASML — ASML Holding | $1,302.47 | Market Cap: $502.0B — The Monopoly with Wobbling Execution
EUV monopoly is unassailable — no competition expected before 2030+. EUR 36B+ order backlog. High-NA EUV ($350M+ per system). But Q4 2025 was a significant miss (-14.7%) — two misses in last 4 quarters. PEG of 2.16 is the most expensive in the group. Only 13% analyst upside. China ban removes 30%+ of addressable market. MONITOR — wait for estimate reset before adding.
Memory Cycle Scenario Matrix
| Stock | HBM Demand Sustains | DRAM Pricing Peaks (H2 2026) | China HBM3 Breakthrough | AI Capex Cuts 20%+ |
|---|---|---|---|---|
| MU | Very Strong — HBM margins expand | Moderate — margins compress but HBM floors earnings | Negative — long-term share risk | Weak — volume + pricing decline |
| DELL | Very Strong — AI server demand sustains | Moderate — server demand continues | Neutral — China not key market | Weak — server orders slow |
| MRVL | Strong — custom silicon demand grows | Moderate — controller revenue stable | Neutral — fabless, no China fab risk | Moderate — diversified exposure |
| PSTG | Strong — flash storage for AI workloads | Moderate — storage demand less cyclical | Neutral — no China exposure | Moderate — subscription provides floor |
| AMAT | Strong — memory capex re-accelerating | Moderate — WFE orders slow | Mixed — China opportunity + risk | Weak — WFE spending cuts |
| LRCX | Strong — HBM TSV etch demand | Moderate — 3D NAND etch structural | Mixed — China etch demand | Weak — WFE spending cuts |
| KLAC | Moderate — inspection demand steady | Moderate — inspection less cyclical | Moderate — lower China exposure | Moderate — inspection is last to cut |
| ASML | Moderate — EUV demand for advanced DRAM | Moderate — backlog provides buffer | Negative — China ban eliminates upside | Moderate — EUR 36B backlog cushion |
| STX | Moderate — nearline HDD data demand | Moderate — HDD less correlated | Neutral — no HBM exposure | Weak — data center storage defers |
| WDC | Moderate — enterprise SSD demand | Moderate — NAND pricing benefit | Neutral — no HBM exposure | Weak — SSD demand declines |
Portfolio Construction
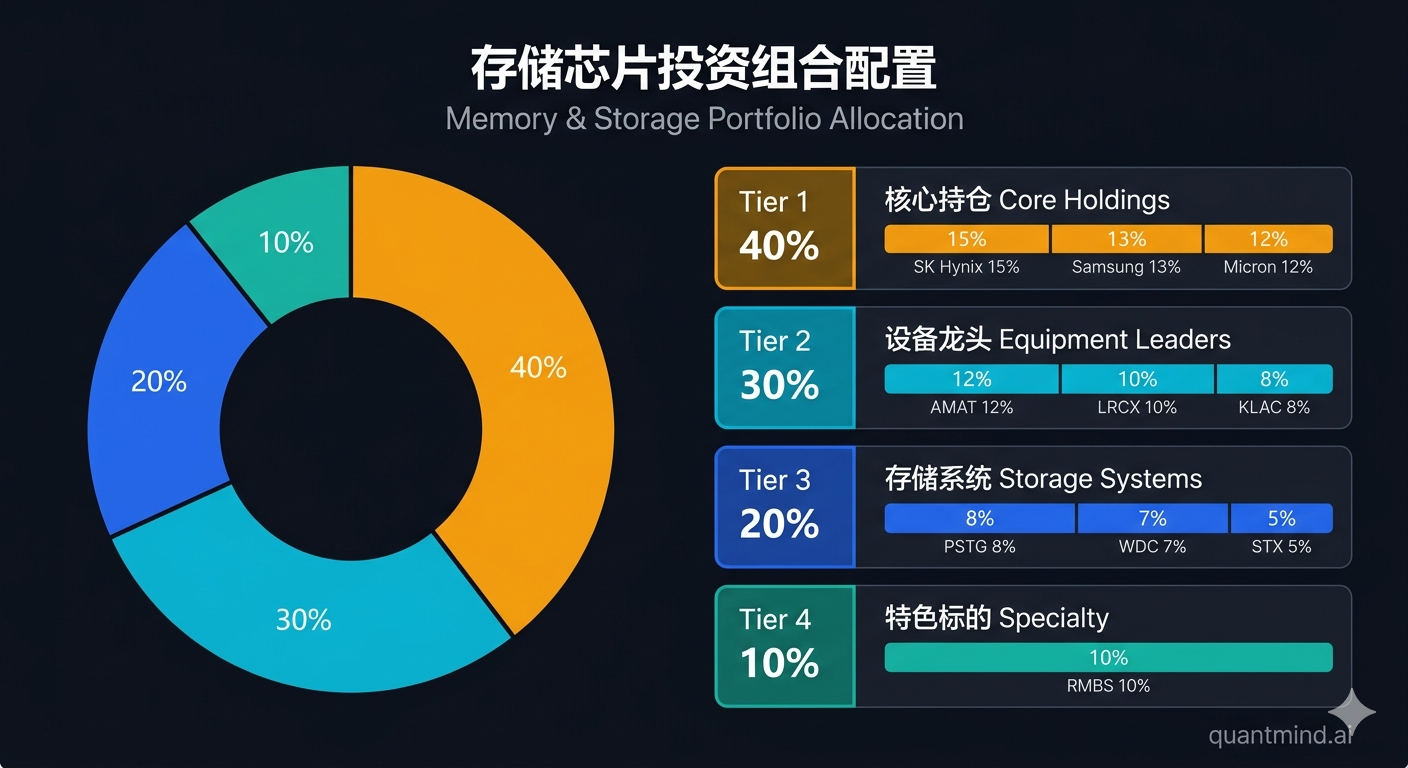
| Tier | Stock | Allocation | Rationale |
|---|---|---|---|
| Core (45%) | MU | 25% | Best value + quality + HBM leadership |
| DELL | 20% | Cheapest growth + AI server #1 | |
| Strategic (30%) | MRVL | 10% | Custom AI silicon inflection |
| PSTG | 5% | Subscription model + flash storage | |
| AMAT | 10% | WFE leader, perfect execution | |
| LRCX | 5% | Structural etch growth | |
| Tactical (15%) | KLAC | 5% | Inspection monopoly |
| WDC | 5% | NAND recovery optionality | |
| STX | 3% | Nearline HDD pricing power (small position due to balance sheet) | |
| ASML | 2% | EUV monopoly (small position due to execution wobble) | |
| Avoid (0%) | — | 0% | No outright avoids, but STX and ASML sized small |
Portfolio characteristics: - Weighted average forward P/E: ~13x (heavily anchored by MU and DELL) - Weighted average beat rate: 93%+ - HBM/AI exposure: 75%+ of allocation has direct or high indirect exposure - China risk: ~15% of portfolio revenue at risk from export controls
6 Investment Philosophy Perspectives
| Philosophy | Verdict | Rationale | Biggest Risk |
|---|---|---|---|
| Quality Compounder (Buffett) | LONG MU, AMAT | Fortress balance sheets + durable competitive advantages + pricing power | Peak-cycle normalization |
| Imaginative Growth (Baillie Gifford) | LONG MRVL, PSTG | Custom AI silicon + subscription storage = paradigm shift | Execution volatility |
| Fundamental L/S (Tiger Cubs) | LONG MU, DELL / SHORT ASML | Value + execution vs expensive + deteriorating beats | Macro reversal |
| Deep Value (Klarman) | LONG MU | 7.6x forward P/E, 0.26 PEG even with peak-cycle caution | Earnings normalization faster than expected |
| Catalyst-Driven (Tepper) | LONG MU, DELL | HBM supply constraints + AI server demand = near-term catalysts | Supply catching up to demand |
| Macro Tactical (Druckenmiller) | LONG memory broadly | Generational supercycle — $440B+ total memory market, WFE to $156B | China capacity buildout disrupts oligopoly |
Variant View
Market consensus: Memory is at peak cycle. DRAM margins of 60%+ are unsustainable. The smart money is rotating out of cyclicals and into “quality” WFE and software. MU at $357 has already priced in HBM.
I disagree. Here’s why: HBM has created a structural demand floor that didn’t exist in prior memory cycles. Previous DRAM downturns were caused by oversupply — but HBM’s 3x wafer consumption, $30-45/GB pricing, and multi-year capacity constraints mean the supply/demand dynamics have fundamentally changed. Consider:
- HBM is not a commodity. It requires advanced packaging, through-silicon vias, and yield expertise that only three companies possess globally. Barriers to entry are measured in years and billions of dollars.
- Each GPU generation doubles memory content. H100 needed 80GB. B300 needs 288GB. Vera Rubin will need 288GB of next-gen HBM4. This content multiplier has no precedent in memory history.
- The crowding-out effect is structural. As long as HBM consumes 3x wafer capacity and earns 6-10x the ASP, manufacturers will rationally prioritize HBM over commodity DRAM — keeping conventional memory tight indefinitely.
- MU at 7.6x forward P/E already prices in a downturn. Even at mid-cycle EPS of $20-25 (vs $47+ peak), MU trades at 14-18x — still reasonable for a company with monopoly-like positioning in a $54.6B market.
The consensus treats HBM like a cycle peak. I treat it as a secular inflection point where memory margins have a structurally higher floor.
If you remember one thing: MU at 7.6x forward P/E, PEG 0.26, 8/8 consecutive beats, $4.6B net cash — those numbers don’t look like a “peak cycle” stock. They look like a growth stock with the wrong label.
Breaking: Google TurboQuant — DeepSeek 2.0 or a Real Threat?
(Updated March 28, 2026)
Three days after this piece was published, Google dropped a bombshell: TurboQuant — an algorithm that compresses LLM inference KV Cache from 16-bit to 3-bit, shrinking memory footprint by 6x, accelerating attention computation 8x on H100, with less than 1% accuracy loss.
The market reaction was violent. SK Hynix -6%, Samsung -5%, MU -7%, Kioxia -6%. MU fell a cumulative 15.5%. Cloudflare’s CEO called it “Google’s DeepSeek moment.”
My take: the market overreacted. This is a buying opportunity, not an exit signal.
Three layers of reasoning:
Layer 1: TurboQuant Compresses Inference Cache, Not Training Memory
| Training | Inference | |
|---|---|---|
| Primary bottleneck | HBM bandwidth + capacity | KV Cache size |
| TurboQuant impact | Virtually none | Significant (6x compression) |
| Memory type | HBM3e ($30-45/GB) | Standard DRAM + HBM mix |
The B300’s 288GB of HBM per GPU is there to hold model weights and run matrix multiplications, not to store KV Cache. Morgan Stanley’s Joseph Moore put it plainly: “This is an evolutionary development, with essentially no surprise for memory.”
Layer 2: Jevons Paradox — Efficiency Gains = More Usage
This is exactly the same logic as DeepSeek. After DeepSeek launched in January 2025, markets panicked that “inference costs are cratering, GPU demand will collapse” — and what happened? Cheaper inference spawned more AI applications, and GPU demand actually accelerated.
SemiAnalysis analyst Ray Wang was more direct: once the KV Cache bottleneck is resolved, model performance improves, which actually drives higher memory consumption — longer context windows, larger models, more concurrent inference.
Efficiency gains never reduce demand — they lower unit costs and expand the total market.
Layer 3: This Is Still in the Lab
TurboQuant will be presented at ICLR 2026 next month. There is no production deployment timeline. From paper to large-scale deployment typically takes 12-18 months. Meanwhile, MU’s HBM capacity is sold out through year-end 2026 — those are signed contracts.
What’s the Real Risk?
Not TurboQuant itself, but what if it’s just the beginning. If Google, Meta, and NVIDIA are all working on similar inference optimizations, and within 6-12 months inference-side DRAM demand gets compressed by 50%+, then the pricing recovery for standard server DRAM (which accounts for 40-50% of MU’s revenue) comes into question — even though HBM remains unaffected.
The irony: MU delivered a blowout quarter just 3 days before TurboQuant dropped: EPS $12.20 vs estimate $8.50 (beat by +43%), revenue $23.86B vs estimate $18.90B (beat by +26%). Then it fell 15% because of a paper that hasn’t left the lab.
If you’ve been hesitating on building a MU position, TurboQuant just gave you a better entry price.
Pre-Mortem: How I Lose Money in Two Years
Writing bullish reports feels good. But what’s actually valuable is thinking through how you lose money.
-
AI bubble bursts + HBM oversupply. The scenario that keeps me up at night: Microsoft and Meta cut 2027 capex by 20%+. Samsung’s HBM expansion floods the market. HBM pricing drops 30-40%. MU’s EPS collapses from $47 to $15-20. DRAM margins revert from 60% to 25%. Memory stocks give back 30-40%. Probability: 20%. This is the eternal curse of cyclicals.
-
CXMT HBM3 breakthrough + sanctions erosion. China achieves domestic HBM3 production at scale by late 2027. US export controls are loosened under trade deal pressure. Chinese hyperscalers shift procurement to domestic HBM. Global HBM pricing power collapses. Probability: 10%. The technical barriers are enormous, but you can’t rule it out entirely.
-
Classic cycle double-top. Non-HBM DRAM and NAND build excess inventory in H2 2026. Smartphone and PC demand weakens. The “structural supply deficit” narrative proves to be a standard cycle peak in disguise. Equipment spending gets cut. 2027 becomes a down year for the entire value chain. Probability: 25%. This is actually the most likely mild bear case.
-
Algorithmic efficiency revolution (TurboQuant as prologue). Google, Meta, and NVIDIA release multiple 6x+ inference memory compression algorithms within 6 months, and they ship to production quickly. Inference-side DRAM demand gets compressed by 50%+. Server DRAM pricing recovery stalls. MU’s 40-50% non-HBM revenue comes under pressure. The market slaps the “peak cycle” label back on memory stocks. Probability: 15%. A single paper isn’t scary, but if it becomes a trend, it’s a real risk.
Honestly, writing this section gave me pause. A 25% probability “classic double-top” is not a tail event — it happens one out of four times. So here’s what I do: MU gets a 25% allocation, but the stop-loss is at $240 — if DRAM contract prices go negative QoQ, I’m out without hesitation.
In a sector like memory, admitting you might be wrong matters far more than insisting you’re definitely right. All those “DRAM supercycle” reports from 2018 had the right thesis — they were just six months late on the timing. I don’t want to repeat that mistake.
Monitoring Variables & Action Triggers
| Variable | Current | Bull Trigger | Bear Trigger |
|---|---|---|---|
| HBM3e contract pricing | $30-45/GB | Sustains above $25/GB through H2 2026 | Drops below $20/GB |
| DRAM contract prices (QoQ) | +90-95% | Continues double-digit QoQ through Q3 2026 | Turns negative QoQ |
| DRAM industry utilization | >90% | Stays above 85% | Falls below 80% |
| DRAM inventory weeks | 2-3 weeks | Stays below 4 weeks | Exceeds 6 weeks |
| Hyperscaler capex guides | MSFT $80B, AMZN $100B+ | Maintained or raised | Cut by 15%+ |
| MU HBM revenue (% of DRAM) | ~25-30% | Exceeds 35% by FQ4 2026 | Stalls below 25% |
| CXMT HBM3 progress | Planning stage | Delays to 2027+ | Achieves volume production in 2026 |
| WFE spending forecast | $139B 2026, $156B 2027 | SEMI raises estimates | SEMI cuts 2027 below $140B |
| ASML order bookings | EUR 36B+ backlog | New orders accelerate | Cancellations emerge |
| Dell AI server backlog | $4B+ | Exceeds $6B | Declines below $3B |
| AI inference compression papers | TurboQuant (1 paper, lab stage) | No production deployment within 6 months | 3+ papers with 6x+ compression within 3 months, with production deployment |
| MU non-HBM DRAM revenue mix | ~70-75% | Falls below 60% (HBM share rising) | Stays above 70% while server DRAM pricing weakens |
Decision Framework
| Stock | Buy | Add | Reduce | Stop |
|---|---|---|---|---|
| MU | $280 (lowered post-TurboQuant) | $300 | $420 | $240 |
| DELL | $145 | $160 | $210 | $125 |
| MRVL | $80 | $88 | $120 | $68 |
| PSTG | $48 | $54 | $75 | $40 |
| AMAT | $280 | $310 | $400 | $240 |
| LRCX | $180 | $195 | $260 | $155 |
| KLAC | $1,200 | $1,350 | $1,650 | $1,050 |
| WDC | $230 | $255 | $320 | $200 |
| STX | $320 | $350 | $450 | $280 |
| ASML | $1,100 | $1,200 | $1,450 | $950 |
Part 3 of “The Geopolitical Edge” series. Part 1: LNG Value Chain | Part 2: Defense & Munitions available on the blog.
Disclaimer: Research and educational purposes only. Not investment advice. Data as of March 22, 2026.