Mar 22, 2026
The New Energy World Order: Why US LNG Stocks May Be the Trade of the Decade
Hormuz Crisis x US Energy Dominance x Europe Double Squeeze x Asian Demand Wave. Full value chain analysis of 10 LNG stocks covering upstream gas, liquefaction, shipping, pipelines, and equipment.
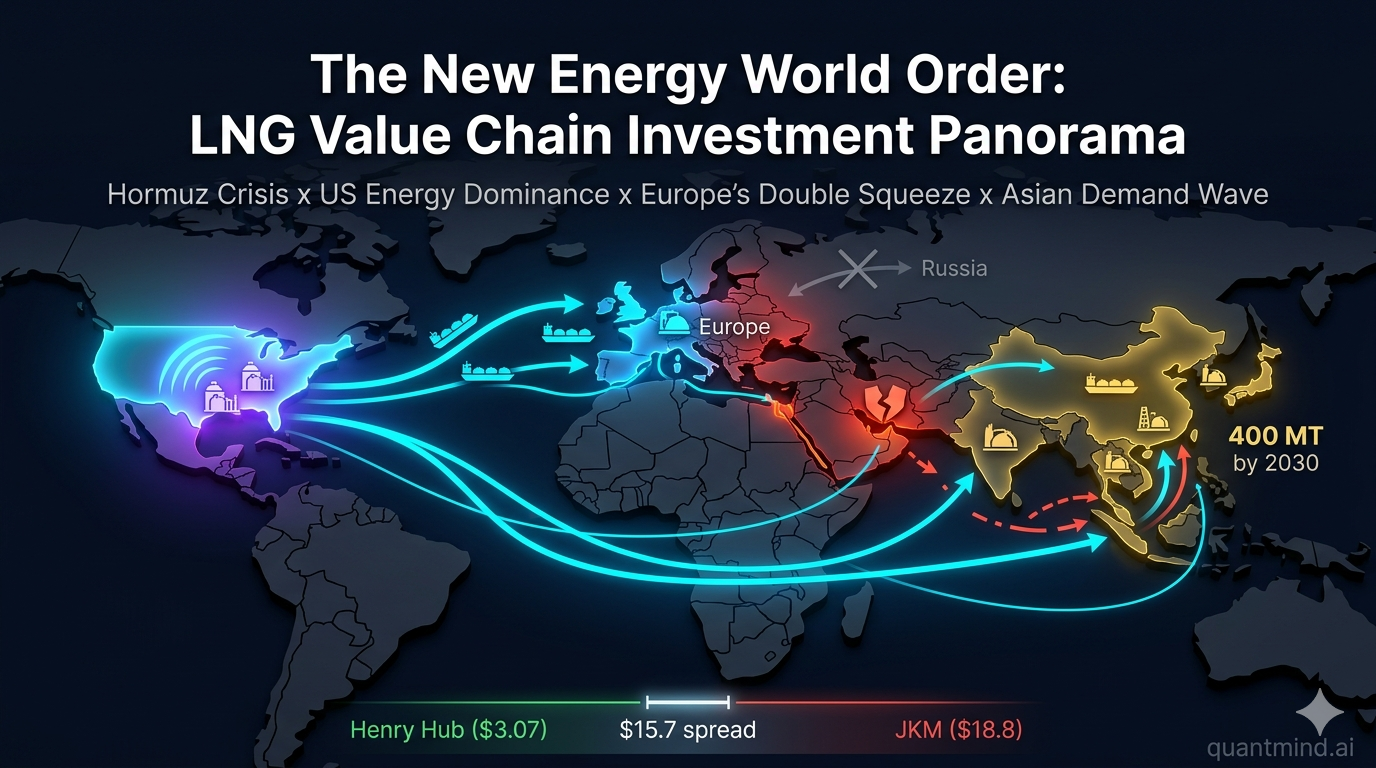
One missile changed the global energy map forever.
On March 2, 2026, Iranian drones struck Qatar’s Ras Laffan — the world’s largest LNG export complex. Within 48 hours, QatarEnergy declared force majeure on all shipments. 20% of the world’s LNG supply vanished overnight.
European gas prices doubled. The JKM-Henry Hub spread exploded to $17/MBtu. And a truth the market had been ignoring became impossible to deny:
US LNG infrastructure isn’t a cyclical commodity play. It’s becoming a strategic national asset.
I spent the past week mapping the entire LNG value chain — 10 stocks, from the gas wells of Appalachia to the shipping lanes of the Strait of Hormuz. I ran full fundamental analysis on every name: valuation snapshots, financial health ratings, earnings beat/miss history, peer comparisons, intrinsic value estimates. Here’s what I found.
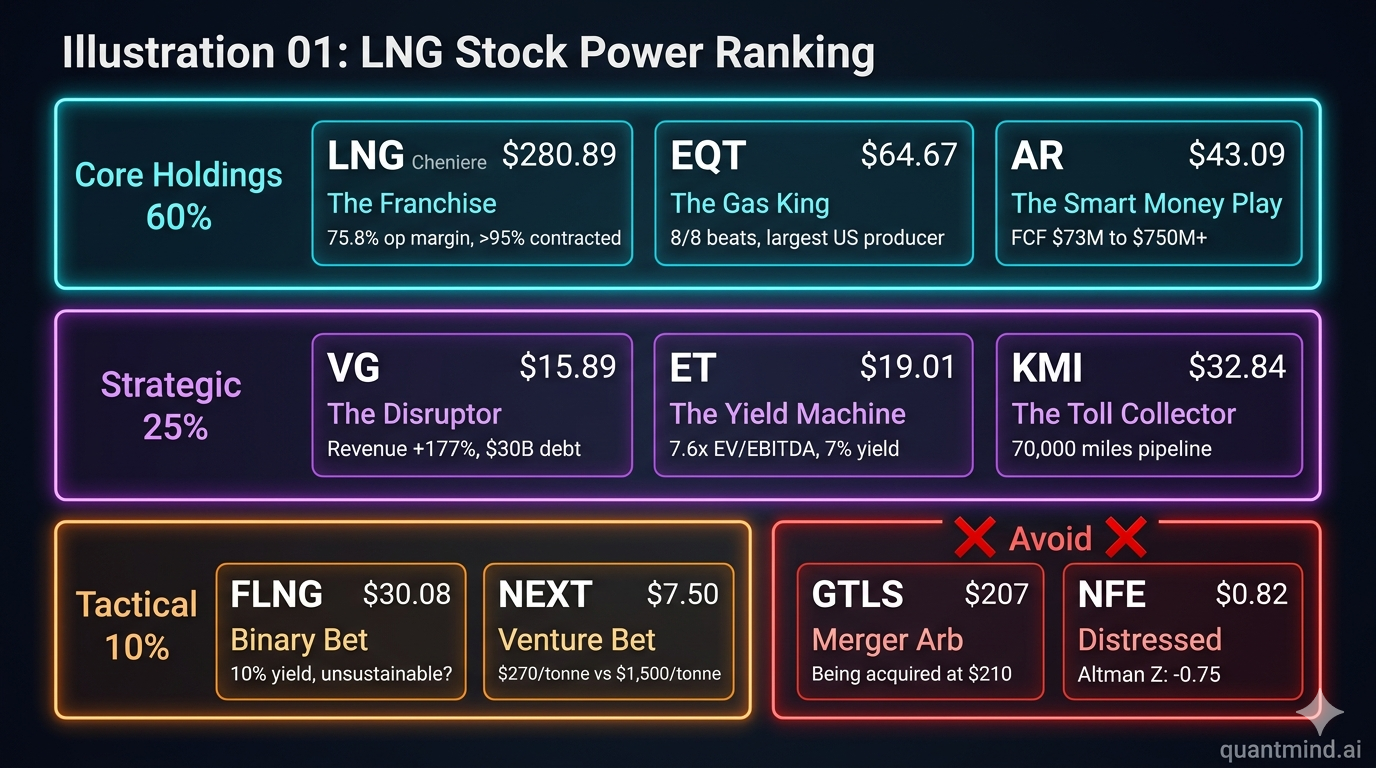
TL;DR: - Top Conviction: LNG (Cheniere) — world-class franchise at fair valuation, >95% contracted, 75.8% operating margins - Best Risk/Reward: EQT — 8/8 earnings beats, largest US gas producer, direct feedstock play on LNG exports - Highest Upside (with risk): VG (Venture Global) — down 36% from IPO, FY2026 EBITDA guidance $5.2-8.0B, but $30B debt and legal overhang - Best Income Play: ET — cheapest large-cap midstream (7.6x fwd EV/EBITDA), 7% yield, pivoting to data center gas demand - Avoid: NFE (restructuring at $0.82), GTLS (merger-arb at $210 deal price)
The Three Forces Reshaping LNG
Force 1: The Hormuz Supply Shock
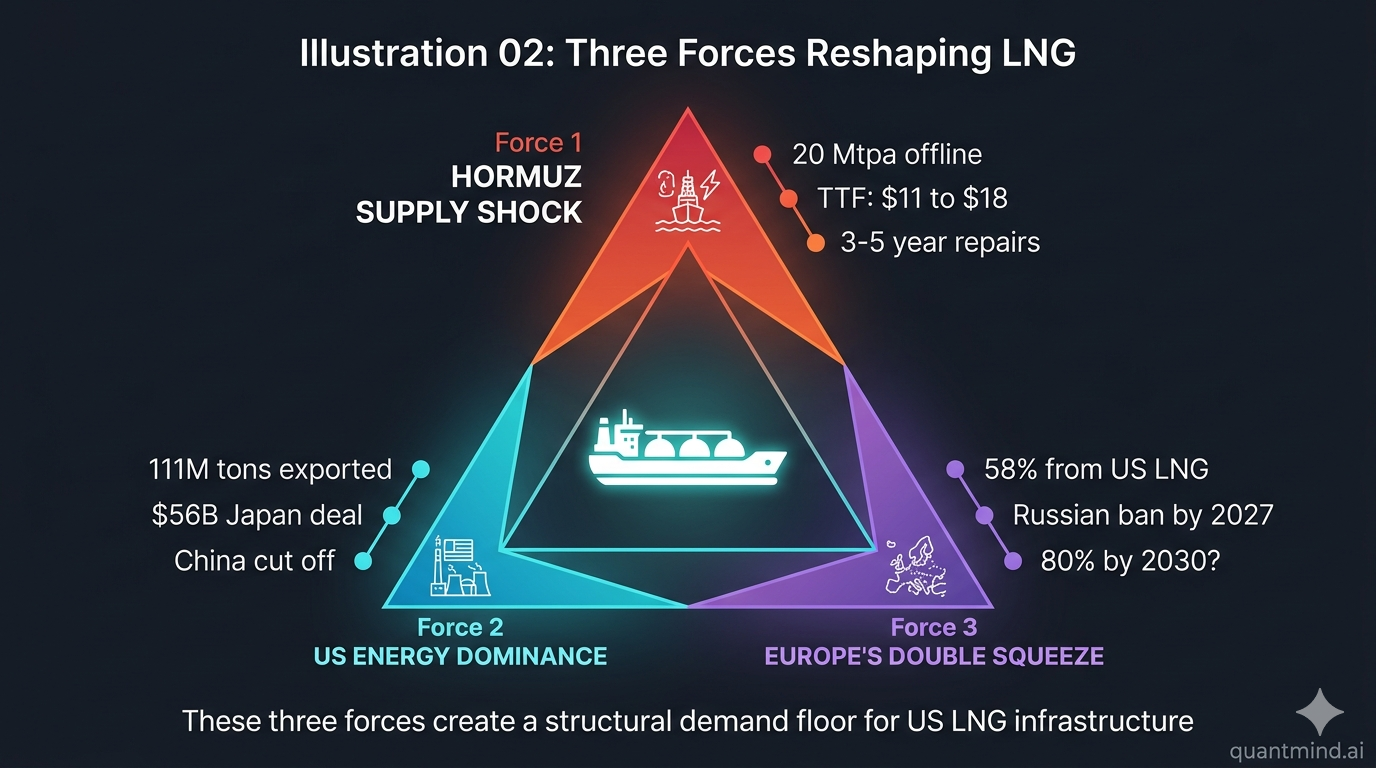
Qatar was supposed to be expanding to 142 Mtpa by 2030. Instead, Iranian retaliatory strikes on February 28 damaged Ras Laffan facility. Rystad estimates 20 Mtpa is offline for 3-5 years. Tanker traffic through Hormuz dropped 70%. Insurance premiums hit 1% of vessel value per voyage.
Market impact: - TTF surged from $11.1 to $18.1/MBtu within days - JKM-Henry Hub spread widened to ~$17/MBtu (vs. ~$6 pre-crisis) - Brent crude briefly touched $119 - Daily LNG tanker freight rates jumped 40%+
The countries most exposed? Pakistan (99% of LNG from Gulf states), India (53%), Bangladesh (72%). Europe gets 12-14% of its LNG from Qatar.
Who benefits: US LNG exporters (LNG, VG) capture the widened JKM-HH spread on spot/uncontracted volumes. Upstream producers (EQT, AR) benefit from higher Henry Hub and growing LNG feed gas demand. Pipeline operators (KMI, ET) see accelerated demand for Gulf Coast takeaway capacity.
The winner: every molecule of non-Gulf LNG just became more valuable.
Force 2: US Energy Dominance as Foreign Policy
The Trump administration isn’t just exporting gas — they’re weaponizing it:
- Japan: $56B energy deal signed March 14, 2026; $44B Alaska LNG joint venture proposed
- EU: $250B annual energy import framework agreed August 2025; EU now gets 58% of LNG from US (up from ~20% in 2021)
- China: Effectively cut off since February 2025 via 15% tariff. Last US LNG cargo arrived Feb 6, 2025.
- Permits: DOE reversed Biden’s LNG pause on day one; authorized 11.45 Bcf/d total export volume
The US exported a record 111 million tons in 2025 — 25% of global trade. Capacity is doubling by 2031.
Investment implication: US LNG infrastructure is becoming a strategic national asset. This creates a policy floor under investment — reducing regulatory risk for the entire sector.
Force 3: Europe’s Double Squeeze
The EU banned all Russian gas by late 2027 (Council approved January 26, 2026). Russia went from 40% of EU gas to 6%. Between 2022-2024, Europe commissioned 12 new LNG terminals adding 70 bcm of import capacity. Germany alone brought online terminals at Wilhelmshaven, Mukran, Stade, and Lubmin.
But here’s the catch — the US now supplies 58% of EU LNG imports. IEEFA warns it could hit 80% by 2030.
Europe just traded one energy dependency for another. And their new supplier views energy as leverage.
Where the Money Is: The LNG Profit Pool
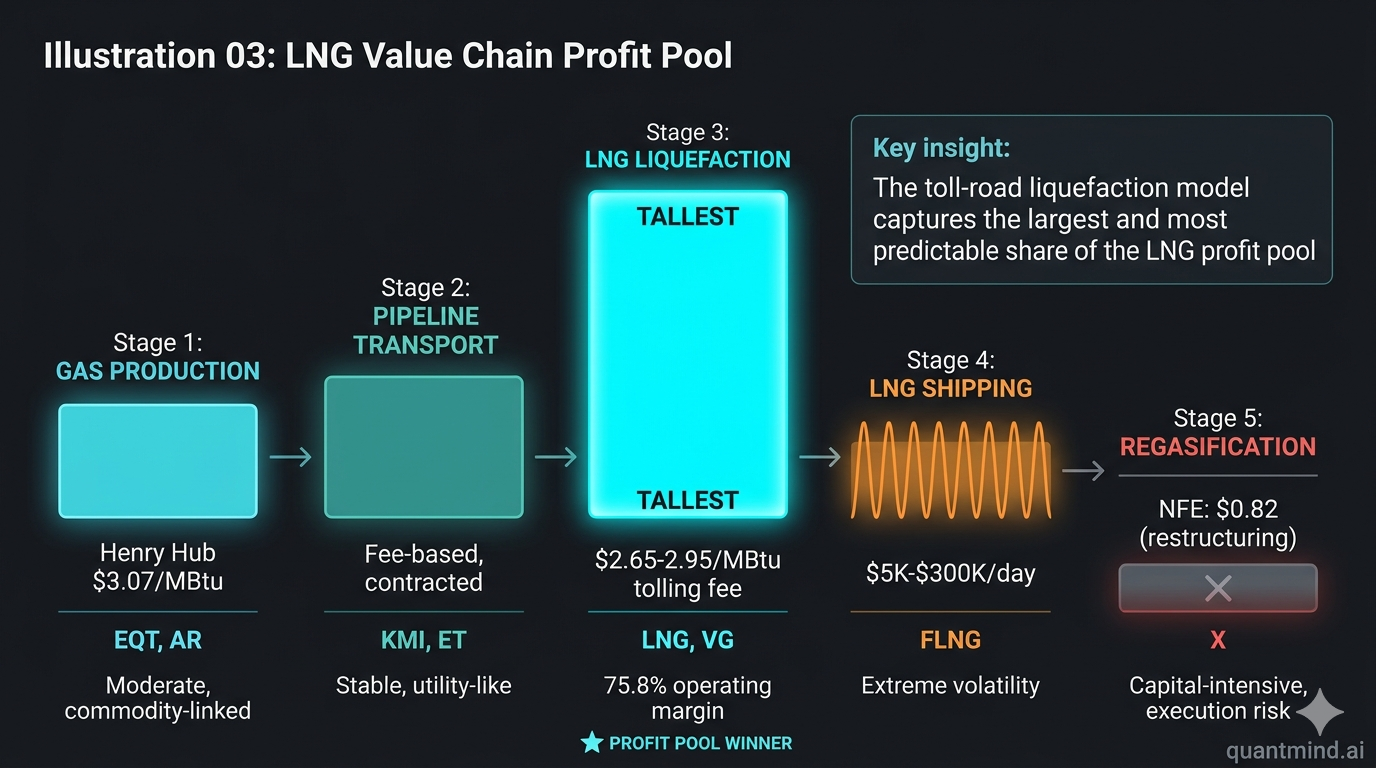
Not all parts of the value chain are created equal:
| Segment | Margin Profile | Key Metric | Best Play |
|---|---|---|---|
| Upstream E&P | Moderate, commodity-linked | Henry Hub ~$3.07/MBtu | EQT, AR |
| Liquefaction | Highest & most stable | Tolling fee $2.65-2.95/MBtu on 20-yr contracts | LNG, VG |
| Shipping | Extreme volatility | Spot: $5K-$300K/day in 12 months | FLNG |
| Pipelines/Midstream | Stable, fee-based | Contracted capacity + utilization | KMI, ET |
| Equipment/EPC | Backlog-driven, cyclical | Book-to-bill ratio | GTLS (being acquired) |
| Regas/LNG-to-Power | Moderate, utility-like | Contracted offtake + power prices | NFE (distressed) |
The toll-road model wins. Cheniere collects fees on >95% of its volumes regardless of commodity prices — then prints extra money when spreads widen on the remaining 5%. That’s a 75.8% operating margin. Best in class.
Pipelines are the lower-risk LNG beneficiary. KMI’s $7B+ pipeline buildout and ET’s diversified midstream network provide contracted, fee-based exposure without commodity or project risk.
Shipping is a trading vehicle, not a compounding investment. Spot rates oscillating between $5,000/day and $300,000/day in 12 months demonstrates extreme cyclicality.
The Power Ranking: 10 LNG Stocks Analyzed
Tier 1: Core Holdings (Highest Conviction)
LNG — Cheniere Energy | $280.89 | Market Cap: $60.5B
The Franchise Player
| Metric | Value | Signal |
|---|---|---|
| P/E (TTM) | 11.6x | Cheapest among peers |
| Forward P/E | 19.5x | Earnings normalizing |
| EV/EBITDA | 7.9x | Cheapest in peer group |
| Operating Margin | 75.8% | Best-in-class |
| FY2025 Revenue | $19.7B | +12.3% YoY |
| FY2025 Adj. EBITDA | $6.9B | — |
| FY2026E EBITDA | $6.75-7.25B | Guided |
| Contract Coverage | >95% | 20-year take-or-pay SPAs |
| Debt/Equity | 2.96x | Structural (backed by contracts) |
| Beta | 0.24 | Defensive |
Bull case: Cheniere is the Visa of LNG — a toll-road franchise that collects fees on every molecule that flows through its terminals. With >95% of volumes contracted for 10+ years and the best operating margins in the industry (75.8%), Cheniere generates predictable, annuity-like cash flows regardless of commodity prices. Corpus Christi Stage 3 adds 10+ Mtpa of capacity, with each train adding $1-2B in annual EBITDA.
Bear case: Three consecutive EPS misses (Q2-Q4 2025) as European crisis pricing normalizes. Forward P/E expands to 19.5x, meaning the market is already pricing lower forward earnings. The $23.4B debt load is massive, though serviced by contracted cash flows.
Geopolitical edge: The Hormuz crisis massively benefits Cheniere’s uncontracted spot volumes. The JKM-HH spread at ~$17/MBtu means Cheniere is printing money on its ~5% uncontracted capacity. More importantly, European buyers will be desperate to sign additional long-term SPAs with Cheniere as they lose Qatari supply.
Variant View: The market sees earnings normalization as a negative. We see it as the floor — the contracted base provides $6.75-7.25B EBITDA regardless, and the Hormuz crisis creates upside that isn’t priced in at $280.
Action: HOLD/ACCUMULATE on dips to $240-250. Core position.
EQT Corporation | $64.67 | Market Cap: ~$30B
The Gas King
| Metric | Value | Signal |
|---|---|---|
| P/E (TTM) | 19.5x | Fair |
| Forward P/E | ~16.8x | Modest discount |
| EV/EBITDA | 8.0x | Near peer median |
| Operating Margin | 55% | 2nd best among gas E&P peers |
| FY2025 Revenue | $9.1B | +74% YoY |
| FY2025 Sales Volume | 609 Bcfe (Q4) | Above guidance |
| Consecutive Beats | 8/8 | 100% beat rate |
| Surprise Trend | Improving (+27% avg recent) | — |
| Debt/Equity | 0.33x | Conservative |
| Altman Z-Score | 2.27 | Grey zone (normal for E&P) |
Bull case: EQT is the largest US natural gas producer with 19.1 Tcfe of proved reserves — multi-decade reserve life. The 8/8 consecutive earnings beat streak (100% beat rate) signals exceptional execution that analysts haven’t fully captured. The Equitrans Midstream merger creates vertical integration. Mountain Valley Pipeline expansions add >1 Bcf/d of additional takeaway capacity to Gulf Coast LNG terminals.
Bear case: Pure-play natural gas exposure (~85-90% of revenue). A collapse in Henry Hub prices would directly compress earnings. Current ratio of 0.76 is below 1.0 (structural for E&P).
Geopolitical edge: LNG feed gas demand is expected to reach 19.8 Bcf/d in 2026 (+19% YoY) and could exceed 34 Bcf/d by 2030. EQT’s Appalachian gas is the lowest-cost feedstock for the expanding Gulf Coast LNG terminal complex. The more LNG terminals the US builds, the more gas EQT sells.
Variant View: The market treats EQT as a commodity stock tied to Henry Hub. But EQT’s strategic position as the primary gas supplier for America’s expanding LNG export machine deserves a “toll-road adjacent” premium.
Action: BUY. Best risk/reward in the universe. $71.69 blended fair value implies +10.9% upside, with asymmetric upside if Henry Hub rises or LNG exports accelerate.
Tier 2: Strategic Positions (Higher Risk/Reward)
VG — Venture Global | $15.89 | Market Cap: $38.7B
The Disruptor Under Fire
| Metric | Value | Signal |
|---|---|---|
| P/E (TTM) | ~16x | Moderate |
| EV/EBITDA | ~12x | Premium to Cheniere |
| FY2025 Revenue | $13.8B | +177% YoY |
| FY2025 EPS | $0.86 | — |
| FY2026E EBITDA | $5.2-8.0B | Wide guidance range |
| Total Debt | $30.1B | Extreme leverage |
| Debt/Equity | 2.9-5.9x | RED FLAG |
| Interest Coverage | ~2.0x | Borderline |
| IPO Price | $25.00 | Currently -36% |
Bull case: Venture Global is building the most ambitious LNG expansion in history. Plaquemines Phase 1 is ramping (first cargo December 2024), CP2 Phase 1 achieved FID with $15.1B in financing (largest standalone project financing ever), and CP2 Phase 2 achieved FID on March 13, 2026 ($8.6B financing). If VG executes to its 100+ Mtpa vision, FY2026 EBITDA of $5.2-8.0B makes the stock extraordinarily cheap at $15.89.
Bear case: $30B+ in debt with interest coverage at ~2.0x. Legal disputes with Shell, BP, and other offtake counterparties over Calcasieu Pass contracts. Only 4 quarters of public earnings data, all showing EPS misses. Analyst consensus ($11.40-13.29) implies ~20% overvalued.
Geopolitical edge: The Hormuz crisis validates VG’s aggressive expansion thesis. With Qatari supply damaged for 3-5 years, the world needs every molecule of US LNG capacity it can get.
Action: SPECULATIVE BUY with tight stops. Position size 50% of standard. Entry better at $12-13.
AR — Antero Resources | $43.09 | Market Cap: $13.3B
The Liquids-Rich Gas Play
| Metric | Value | Signal |
|---|---|---|
| P/E (TTM) | 21.2x | Elevated for E&P |
| Forward P/E | 11.7x | Attractive |
| EV/EBITDA | 9.7x | In-line with peers |
| FY2025 Revenue | $5.14B | Q4 +20.8% YoY |
| FCF Inflection | $73M (2024) to $750M+ (2025) | Massive turnaround |
| Debt/Equity | 0.15x | Conservative (improved from 54.7%) |
| NGL Mix | 38% of reserves | Key differentiator |
| Production | 3.4-3.5 Bcfe/d | Including 208 MBbl/d liquids |
Bull case: Antero’s liquids-rich portfolio (38% NGLs) provides a margin buffer that pure-gas peers lack. The FCF inflection from $73M to $750M+ is dramatic. Debt has been slashed (D/E from 54.7% to 14.7% over 5 years). AR consistently captures premium pricing on both gas ($0.16/Mcf above index) and NGLs ($1.52/bbl above index) via Gulf Coast transportation contracts.
Bear case: Only 1 of last 4 earnings beats. Trailing P/E expensive for E&P. Single-basin risk (Appalachian only).
Action: BUY on pullbacks to $38-40. Forward P/E of 11.7x with massive FCF inflection is compelling.
Tier 3: Tactical/Income Positions
ET — Energy Transfer | $19.01 | Market Cap: $65.5B
The Yield Machine
| Metric | Value | Signal |
|---|---|---|
| P/E (TTM) | 15.5x | Fair |
| Forward EV/EBITDA | 7.6x | Cheapest large-cap midstream |
| Distribution Yield | 7.07% | Top-tier |
| FY2025 FCF | ~$3.85B | Positive |
| FY2026E EBITDA | $17.45-17.85B | +9-12% YoY |
| Debt/Equity | 1.77x | Elevated but manageable |
| EPS Beat Rate | 20% (1/5) | Weak |
| Pipeline Network | 125,000+ miles | Largest in US |
| Lake Charles LNG | Suspended Dec 2025 | Pivot to pipelines |
Bull case: Cheapest large-cap midstream (7.6x fwd EV/EBITDA), 7% yield, well-diversified (no segment >30% of EBITDA). Lake Charles suspension removes capex overhang. Data center-driven gas demand is the emerging catalyst (+35% YoY in intrastate gas segment). DCF models imply 60-129% upside.
Bear case: Persistent EPS misses (20% beat rate). Interest coverage 2.7x. Altman Z-Score 1.37.
Action: BUY for income. 7% yield with 9-12% EBITDA growth.
KMI — Kinder Morgan | $32.84 | Market Cap: ~$50B
The Toll Collector
| Metric | Value | Signal |
|---|---|---|
| P/E (TTM) | 24.6x | Premium to sector |
| EV/EBITDA | ~11.7x | Near peer median |
| Dividend Yield | ~3.5% | Moderate |
| FCF (FY2025) | $2.24B | Positive |
| Pipeline Network | ~70,000 miles | Largest natural gas transmission |
| New Capacity | 3.4 Bcf/d under construction | — |
| Growth CapEx | $7B+ greenlighted | — |
Bull case: Largest natural gas pipeline network (~70,000 miles). Trident Pipeline (2.0 Bcf/d, early 2027) directly connects to Port Arthur LNG. LNG feed gas demand expected to double to 34 Bcf/d by 2030.
Bear case: P/E 24.6x above sector. Only 1 beat in 6 quarters (17%). Fairly valued at $32.84 vs. consensus $33.08.
Action: HOLD. Toll-collector exposure but fully valued. Better entry at $28-30.
FLNG — FLEX LNG | $30.08 | Market Cap: $1.63B
The Dividend Trap?
| Metric | Value | Signal |
|---|---|---|
| P/E (TTM) | 21.8x | Fair |
| Dividend Yield | ~10% | Highest in peer group |
| Dividend/Net Income | 217% | UNSUSTAINABLE |
| Dividend/FCF | 115% | Exceeding free cash flow |
| Debt/Equity | 2.57x | RED FLAG |
| Altman Z-Score | 0.90 | Distress zone |
| Fleet | 13 LNG carriers | All modern (2018-2021) |
Bull case: Hormuz crisis spiked rates from $5K/day to $300K/day. FLNG’s 13 modern carriers are exactly what the market needs. If crisis persists, earnings reverse dramatically.
Bear case: 10% yield is a trap — payout exceeds both earnings (217%) and FCF (115%). Revenue declined 2 consecutive years. Analyst consensus implies ~13% downside.
Action: SPECULATIVE HOLD. Binary outcome — if strait reopens quickly, dividend gets cut; if crisis persists, FLNG could double.
NEXT — NextDecade Corporation | $7.50 | Market Cap: ~$2.0B
The Venture Bet on Rio Grande LNG
| Metric | Value | Signal |
|---|---|---|
| P/E | N/A | Pre-revenue |
| EV/Tonne of Capacity | ~$270/tonne | vs. Cheniere’s ~$1,500/tonne |
| Construction Progress | Trains 1-2: ~65% complete | Ahead of schedule |
| First LNG | H1 2027 (Train 1) | Key de-risking catalyst |
| SPAs Signed | 7.2 MTPA (5 counterparties) | TotalEnergies, Aramco, JERA, EQT, ConocoPhillips |
| EPC Contractor | Bechtel | Gold standard |
| Projected DCF | ~$800M/yr at full operation | Implies $20-25/share bull case |
Bull case: $270/tonne vs. Cheniere’s $1,500/tonne for a project 65% complete with Bechtel and 7.2 MTPA contracted to investment-grade buyers. If Train 1 delivers on time, 2-3x upside.
Bear case: Pre-revenue, $13B+ project debt. Construction delay or cost overrun would be devastating.
Action: SPECULATIVE BUY. Size 0.5-1.0% of portfolio max. Venture-style bet.
Tier 4: Avoid
GTLS (Chart Industries) — $207.19 — Being acquired by Baker Hughes at $210/share. Merger-arb (~1.4% spread), not a fundamental investment.
NFE (New Fortress Energy) — $0.82 — DISTRESSED. Restructuring Support Agreement signed March 17, 2026. Altman Z-Score -0.75. Going-concern doubt. The integrated LNG-to-power dream died of capital starvation.
Geopolitical Scenario Matrix
How does each stock perform under three scenarios?
| Stock | Sustained Tension (TTF >$15, 6+ months) | Detente (TTF $9-11, 3-6 months) | Escalation (Hormuz closed, TTF >$25) |
|---|---|---|---|
| LNG | Strong — spot margins surge | Neutral — contracted base protects | Very Strong — critical Western supplier |
| EQT | Strong — Henry Hub rises, exports accelerate | Moderate — growth continues | Very Strong — every molecule has a buyer |
| VG | Strong — validates expansion thesis | Weak — debt servicing harder | Very Strong — but execution risk persists |
| AR | Strong — NGL diversification + gas uplift | Moderate — forward P/E still attractive | Strong — dual commodity exposure |
| ET | Moderate — pipeline volumes stable | Moderate — 7% yield intact | Moderate — infrastructure demand accelerates |
| KMI | Moderate — pipeline demand steady | Moderate — toll-collector stable | Moderate — buildout accelerates |
| FLNG | Very Strong — charter rates stay elevated | Weak — rates collapse | Extremely Strong — shipping bottleneck |
Portfolio Construction
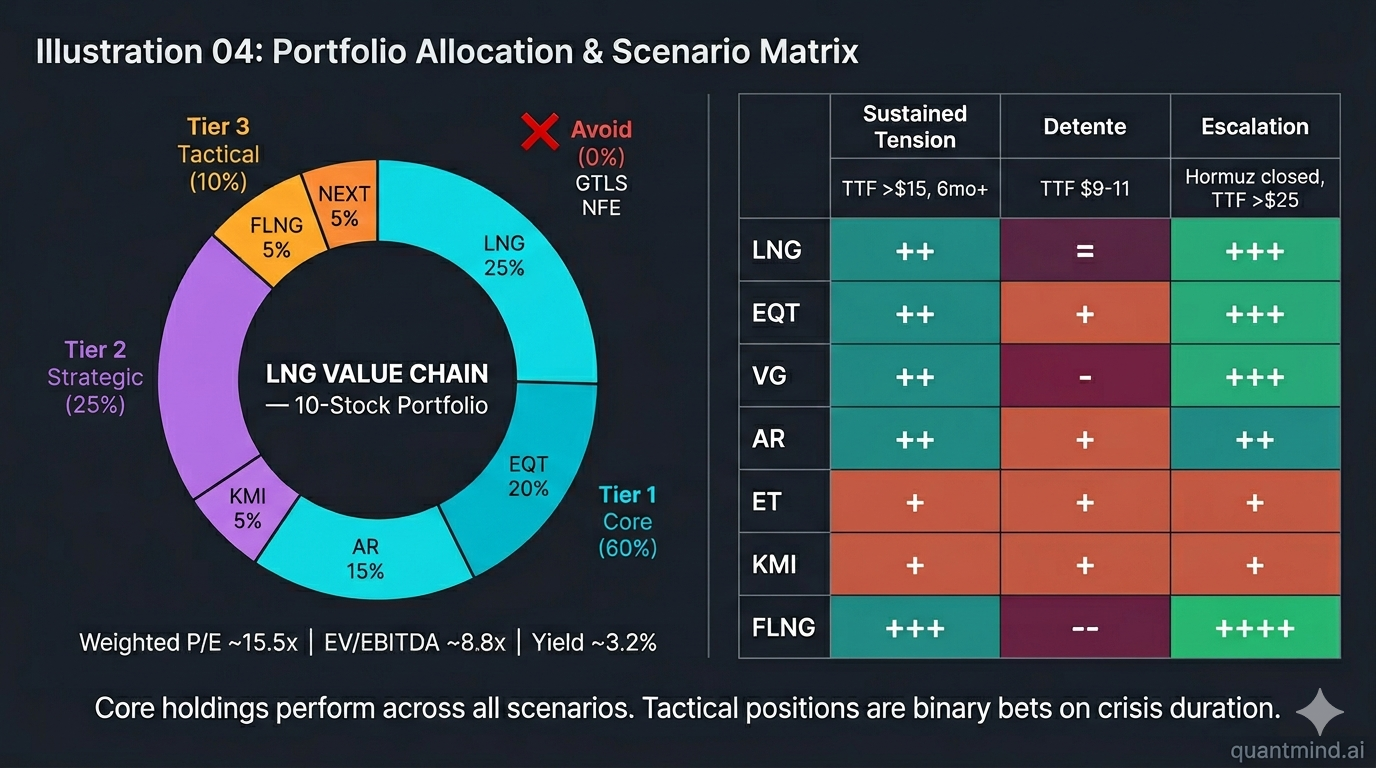
Recommended Allocation (LNG Value Chain Sleeve)
| Tier | Stock | Allocation | Rationale |
|---|---|---|---|
| Core (60%) | LNG | 25% | Franchise quality, contracted cash flows |
| EQT | 20% | Best execution, essential feedstock supplier | |
| AR | 15% | FCF inflection, NGL diversification | |
| Strategic (25%) | VG | 10% | Highest growth optionality (with risk) |
| ET | 10% | Income + cheapest valuation | |
| KMI | 5% | Defensive infrastructure exposure | |
| Tactical (10%) | FLNG | 5% | Hormuz crisis optionality |
| NEXT | 5% | Speculative LNG development | |
| Avoid (0%) | GTLS | 0% | Merger-arb, not fundamental play |
| NFE | 0% | Distressed restructuring |
Portfolio Characteristics
| Metric | Weighted Average |
|---|---|
| P/E (TTM) | ~15.5x |
| EV/EBITDA | ~8.8x |
| Dividend Yield | ~3.2% |
| Geopolitical Sensitivity | High (direct Hormuz beneficiary) |
| Commodity Sensitivity | Moderate (mitigated by contracts) |
6 Investment Philosophy Perspectives
| Philosophy | Verdict | Rationale | Biggest Risk |
|---|---|---|---|
| Quality Compounder (Buffett) | LONG LNG, EQT | Toll-road model + reserve base = durable moats | Leverage; commodity cyclicality |
| Imaginative Growth (Baillie Gifford) | LONG VG | 100+ Mtpa vision could create a second Cheniere | Execution risk, $30B debt |
| Fundamental Long/Short (Tiger Cubs) | LONG EQT / SHORT FLNG pre-Hormuz | 8/8 beats under-appreciated; FLNG dividend unsustainable | Hormuz invalidates the short |
| Deep Value (Klarman) | LONG ET | Cheapest EV/EBITDA, 7% yield, DCF $43 vs $19 | EPS execution, leverage |
| Catalyst-Driven (Tepper) | LONG VG, FLNG | Hormuz = clear re-rating catalyst; CP2 FID de-risks | Crisis resolution speed unknowable |
| Macro Tactical (Druckenmiller) | LONG LNG, EQT, AR | Energy Dominance + Hormuz = structural tailwind | Fed policy, recession risk |
The Variant View
What the market thinks: LNG is cyclical energy facing a supply glut from 2027. The Hormuz crisis is temporary. US gas producers are commodity-price slaves.
What I think the market is missing: US LNG infrastructure should trade at utility/infrastructure multiples (15-20x EV/EBITDA), not energy sector multiples (8x). The combination of European gas bans, Middle East supply destruction, and US foreign policy leverage creates a structural demand floor that transcends commodity cycles. Cheniere’s contracted cash flows are mis-priced as “energy sector” when they function as “infrastructure/utility” assets. EQT’s 8/8 beat streak is under-appreciated because the market treats it as a gas commodity stock rather than the essential feedstock supplier for America’s fastest-growing export sector.
Why the market is wrong: The consensus EV/EBITDA for US LNG infrastructure (~8-10x) compares unfavorably to US midstream pipeline MLPs (10-14x) and is dramatically below European utility multiples (15-20x). If the market re-rates US LNG as “strategic infrastructure” rather than “cyclical energy,” there is 30-50% re-rating upside for Cheniere alone.
Pre-Mortem: Three Ways This Goes Wrong
-
Hormuz resolves quickly (3 months), Qatar repairs ahead of schedule, the supply glut materializes in 2027-2028, crushing LNG spot prices and compressing spreads to $3-4/MBtu. Cheniere’s uncontracted volumes become unprofitable. VG can’t service its $30B debt. Henry Hub falls to $2.
-
Energy transition accelerates. European renewable buildout reduces gas demand. Asian countries skip gas and go directly to renewables + nuclear. Peak LNG demand arrives in 2032 instead of 2038. 20-year contracts become stranded.
-
US policy reversal. A future administration reinstates the LNG export pause. Environmental litigation blocks new permits. The regulatory moat was temporary.
Long-Term Monitoring Variables
Bullish Drivers (Track Quarterly)
| # | Driver | Metric | Current Baseline | Alert Threshold |
|---|---|---|---|---|
| 1 | LNG export growth | US LNG exports (MTPA) | 111 MT (2025) | If <100 MT in any trailing 12mo |
| 2 | JKM-HH spread | Monthly average spread | ~$17/MBtu (crisis) / ~$6 (normal) | If <$4/MBtu sustained 2 quarters |
| 3 | EU Russian gas phase-out | % of EU gas from Russia | 13% (2025) | If phase-out timeline delayed |
| 4 | New contract signings | Long-term SPA announcements | Multiple per quarter | If no new SPAs for 2+ quarters |
| 5 | LNG feed gas demand | Daily Bcf/d to Gulf Coast terminals | 16.6 Bcf/d (2025) | If plateaus below 18 Bcf/d |
Risk Triggers
| # | Risk | Early Warning Signal | Impact |
|---|---|---|---|
| 1 | Hormuz reopens fully | Iranian statement + insurance normalization | Spot rates collapse, FLNG -30%, VG pressure |
| 2 | Henry Hub collapse | Permian associated gas surge + warm winter | EQT, AR earnings compressed 30-50% |
| 3 | VG legal resolution adverse | Court ruling in Shell/BP disputes | VG -20-30%, contract repricing risk |
| 4 | US LNG permit pause | Executive order or court injunction | All US LNG stocks -10-15% |
| 5 | China demand substitute | Power of Siberia 2 pipeline FID | Reduces global demand growth 20-30 MTPA |
Action Triggers
| Signal | Action | Sizing |
|---|---|---|
| JKM-HH spread >$20/MBtu sustained 1 month | Add to LNG, EQT | +5% each |
| VG drops below $10, no adverse legal ruling | Add to VG | +5% (speculative) |
| EQT drops below $55 | Add to EQT | +5% |
| FLNG dividend cut announced | Sell FLNG | 100% exit |
| Henry Hub <$2.50/MBtu for 2+ months | Reduce EQT, AR | -50% each |
| Hormuz reopens, TTF <$10 | Reduce VG, FLNG; hold LNG, KMI | Rebalance to Core only |
Decision Framework
| Stock | Classification | Buy | Add | Reduce | Stop |
|---|---|---|---|---|---|
| LNG | Core | $240 | $250 | $320 | $200 |
| EQT | Core | $55 | $60 | $80 | $48 |
| AR | Core | $38 | $40 | $55 | $33 |
| VG | Strategic | $10 | $13 | $22 | $8 |
| ET | Strategic | $16 | $18 | $24 | $14 |
| KMI | Strategic | $28 | $30 | $38 | $25 |
| FLNG | Tactical | $24 | $28 | $38 | $20 |
Bottom Line
The Hormuz crisis didn’t create the US LNG opportunity — it revealed it. The structural forces (European dependency, US policy leverage, Middle East vulnerability) were already in place. The missile just made them impossible to ignore.
For investors willing to look past “energy sector” labels, the LNG value chain offers something rare: infrastructure-quality cash flows at commodity-sector valuations.
The gap won’t last forever.
Disclaimer: This analysis is for research and educational purposes only. Not investment advice. The author may hold positions in securities discussed. Data as of March 22, 2026.