Apr 6, 2026
Day 37: The Strait Didn't Open. It Didn't Close. It Changed Management.
Day 37 of the Iran war: the strait didn't open or close — Iran turned Hormuz into a toll booth. Four scenarios, four trade setups, three key signals. Trading playbook v2, fully updated.
Day 37: The Strait Didn’t Open. It Didn’t Close. It Changed Management.
37 days ago, I gave you a four-scenario table. Today: it was all wrong.
On March 3rd — Day 4 of the war — I published a trading playbook. Four-row scenario table: ceasefire, 4-week consensus, extended disruption, full blockade. Goldman said there was $14 of risk premium in oil, pricing a 4-week closure. The market bet row two. So did I.
37 days later, reality slapped everyone — including me.
The strait didn’t open. It didn’t close. It changed management.
Iran didn’t blockade Hormuz. It did something smarter — turned it into a toll booth. $2 million per ship, IRGC vetting, confirmation codes, selective enforcement. The entire world minus America is lining up to buy a ticket.
My four-scenario table from March 3rd? None of them hit. Reality took a fifth path — one I didn’t imagine, but one that’s far more tradeable.
This is v2 of that playbook. Framework rebuilt from scratch.
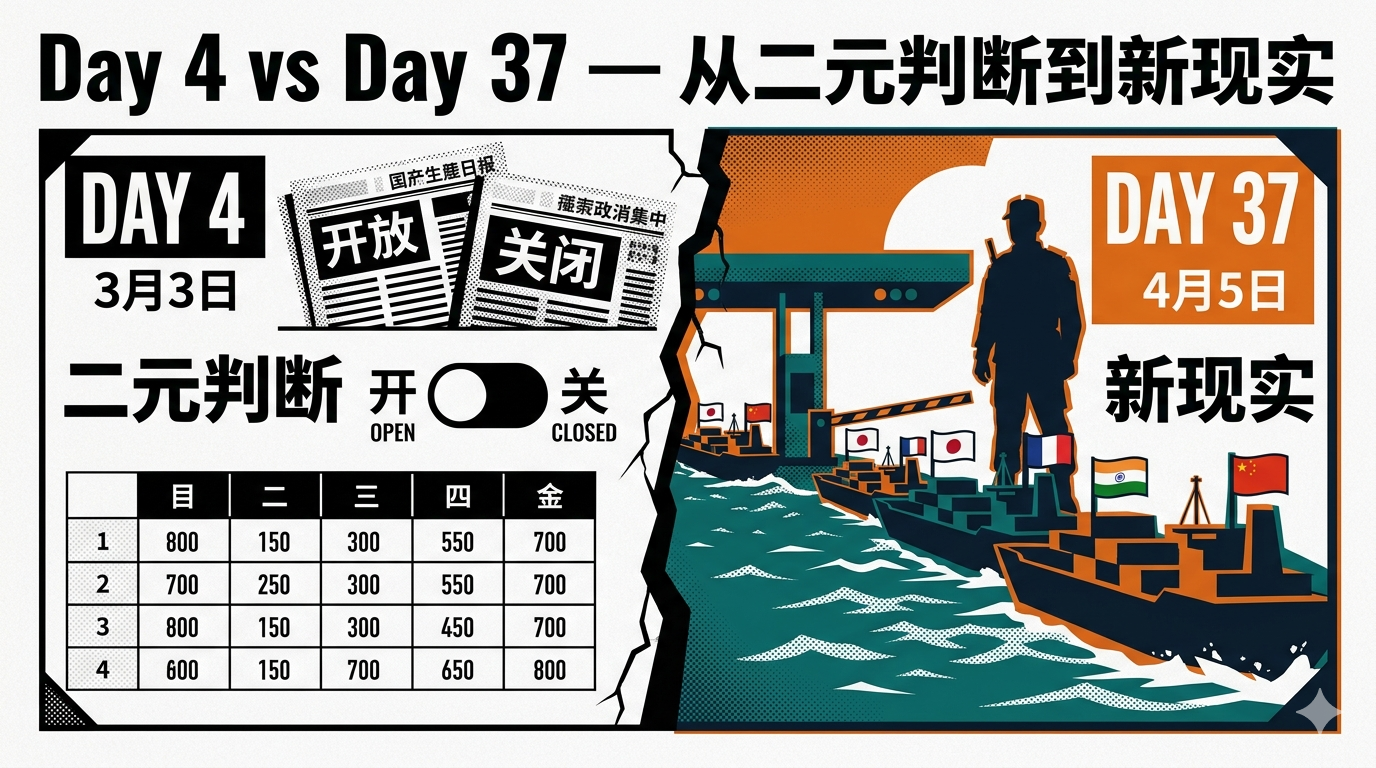
Where We Were Wrong
On March 3rd, I used a binary framework: the strait is either open or closed. All scenarios ran along that single axis — the only variable was duration and how high oil would go.
The underlying assumption was wrong.
Here’s what publicly available data has shown us over the past 37 days:
Traffic data: - Pre-war: ~138 ships/day through Hormuz - Mid-March: near zero - April 2nd: at least 15/day — up from 2-5/day just two weeks prior (Lloyd’s List) - April 4th: 15-18/day and accelerating - AIS tracking dramatically undercounts actual traffic — dark transits (AIS-off ships) account for roughly half (Bloomberg)
The toll mechanism (per NBC, Bloomberg, Al Jazeera): Submit ship info → IRGC vets for US ties → payment (mainly diplomatic asset unfreezing, not the yuan/crypto story the media loves) → confirmation code issued → escorted through the Qeshm-Larak channel. Rate: ~$2 million per vessel.
The line is getting longer: First five countries on March 26 (China, Russia, India, Iraq, Pakistan), doubled within a week — Malaysia, Thailand, Philippines, France, Japan all in. A Greek Dynacom vessel ran full speed through the center of the strait. This isn’t covert passage — it’s openly buying the road.
Which brings me to a bigger analogy. Turkey has managed the Bosphorus under the 1936 Montreux Convention for nearly 90 years — commercial ships transit freely, warships are restricted, wartime closure at Turkey’s discretion. NATO never dismantled it. Iran is now trying to do the same thing at Hormuz.
For investors, this means: stop waiting for “the blockade to end.” This isn’t a blockade. It’s the seed of a new order.
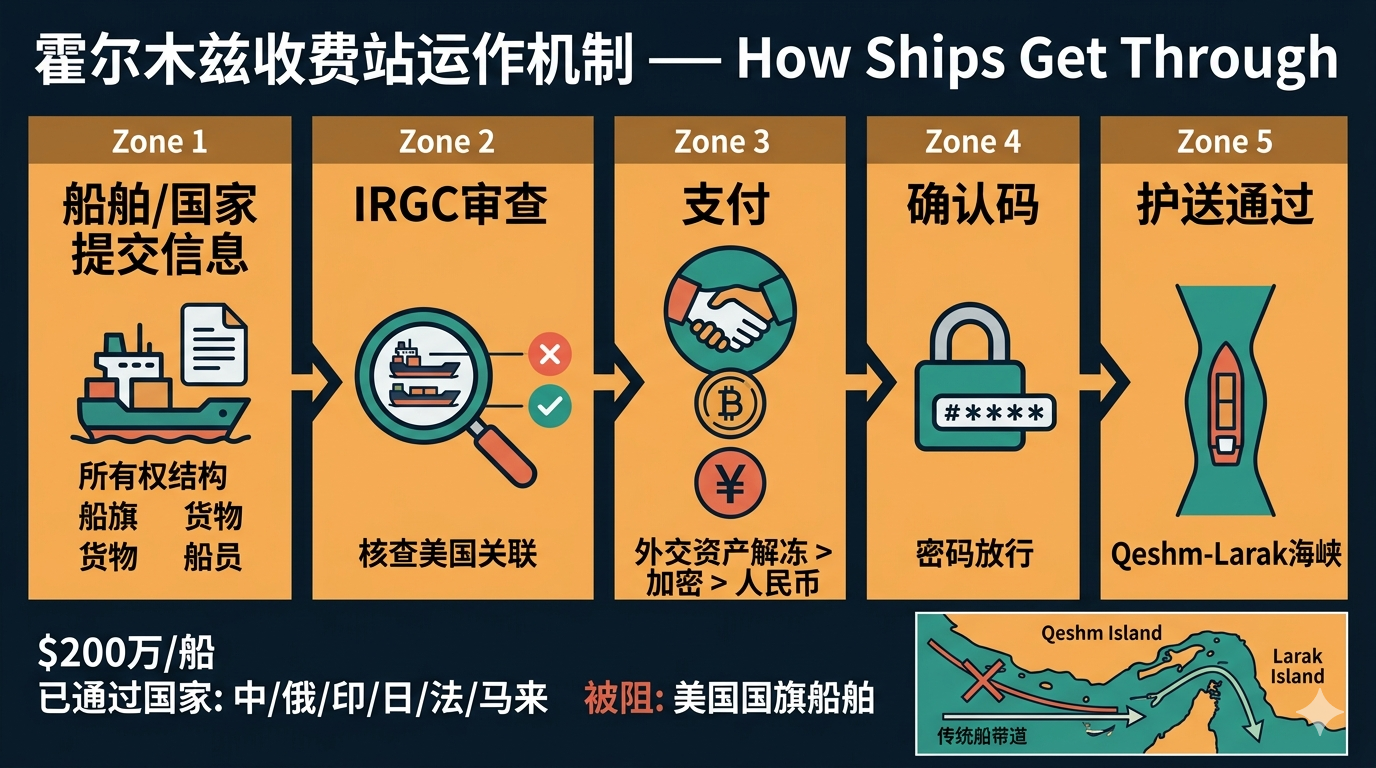
New Framework: Not a Blockade — a Toll Road
Old question: Is the strait open or closed? New question: Who gets through, who doesn’t, and at what cost?
This changes the underlying logic of every trade.
- Blockade → everyone loses → long oil, short global equities
- Toll road → selective damage → long the ones with a pass, short the ones without
That’s why you need an entirely new scenario framework. Four scenarios below, each with specific triggers, trades, and kill switches. You don’t need to memorize all four — just figure out which one is happening.
Four Scenarios, Four Trade Setups
Scenario A: Toll Booth Normalizes (BASE CASE) — Most likely, most money
Probability: Highest Trigger: Strait daily traffic recovers to 50%+ of pre-war levels (>70 ships/day) by mid-May Core logic: Iran doesn’t want the strait closed. Every non-US country is lining up. Traffic will keep rising, but under Iranian management.
Trades:
| Ticker | Direction | Logic |
|---|---|---|
| DOW ($41.61) | Long | 20% of global petrochemical capacity is blocked. US ethane-based producers are unaffected. CEO says normalization takes 250-275 days — even if the strait opens tomorrow, high margins persist into 2027 |
| WLK ($116.65) | Long | Same thesis. US petrochemical companies sit on the right side of the supply disruption |
| CLZ2026 (~$71) vs front-month CL (~$111) | Long back / short front | The $40 backwardation says “the market bets on a short disruption.” If the toll booth becomes the norm, the back end is mispriced |
| BWET ($132) | Hold / trim | +275% YTD, VLCC rates >$200k/day. Still running but chasing risk is elevated |
Invalidation: Traffic drops back below 5 ships/day by late April
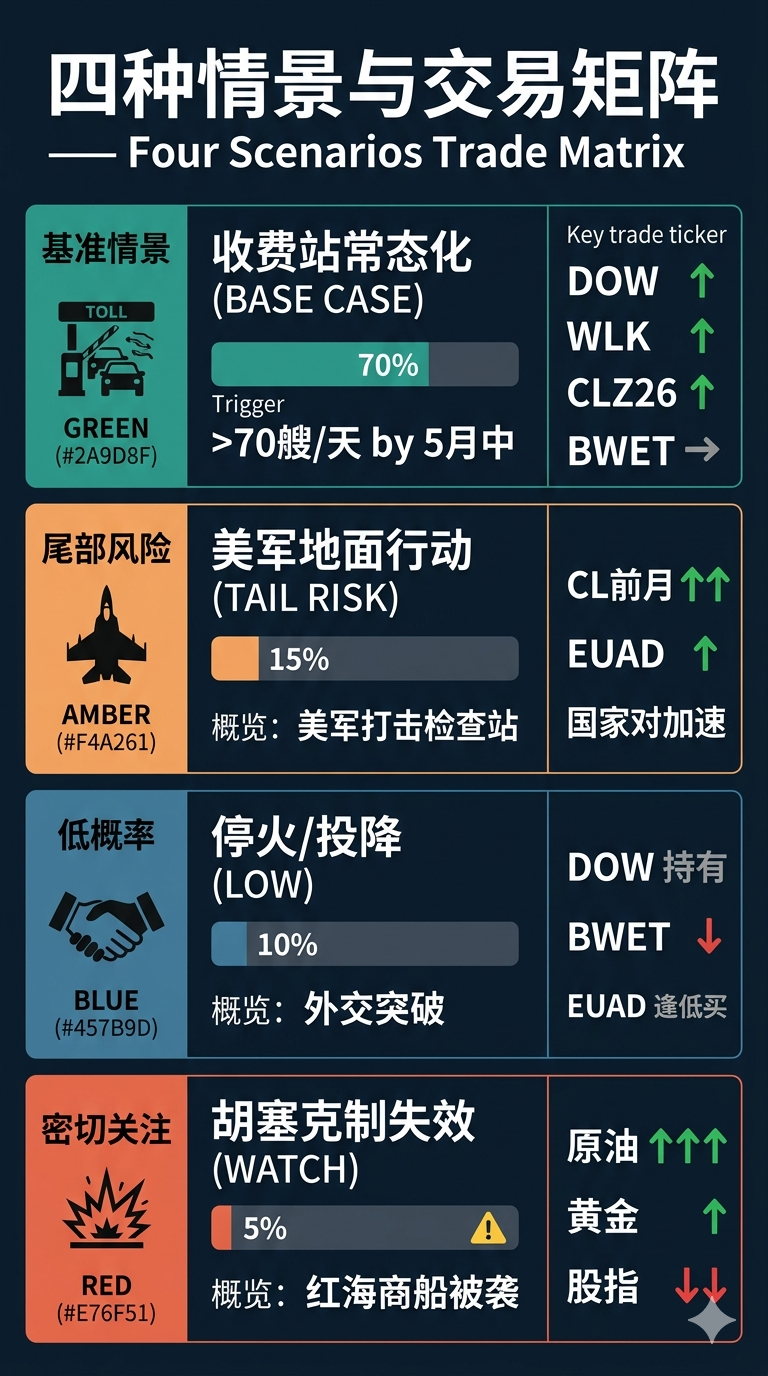
Scenario B: US Ground Operation Shuts Down the Toll (TAIL RISK)
Probability: Low but non-negligible Trigger: US forces specifically target Iranian checkpoint infrastructure in the strait Core logic: Toll booth destroyed → strait goes fully dark short-term → all countries’ transit arrangements void → crude spikes
Trades:
| Ticker | Direction | Logic |
|---|---|---|
| Front-month crude | Long (options preferred) | $130+ target. Use options, not spot — nonlinear risk will destroy short legs first |
| EUAD ($42.41) | Long | European defense spending moving from 2% to 3.5% GDP is structural. Ground war accelerates the timeline |
| All country pairs (see below) | Accelerate | Countries without transit deals take the biggest hit |
Invalidation: US accepts the toll booth status quo as a temporary solution
Scenario C: Ceasefire / Iran Capitulation (LOW PROBABILITY) — Scariest headline, smallest actual damage
Probability: Low Trigger: Diplomatic breakthrough or Iranian military collapse Core logic: This is the headline longs fear most — “ceasefire reached.” But structural damage is already done. You can’t undo it.
Trades: Hold DOW/WLK (petrochemical rebuilds take 250+ days — margins don’t collapse), reduce BWET, buy the dip on EUAD (European defense shift is permanent), hold energy independence names (nuclear renaissance, LNG infrastructure decisions are already made).
One line: Every ceasefire-rumor pullback is a buying opportunity.
Scenario D: Houthi Restraint Breaks (WATCH CLOSELY)
Probability: Not triggered so far, but conditions are building Trigger: ANY Houthi attack on a Red Sea commercial vessel Core logic: Hormuz + Red Sea dual chokepoint closure = global economic catastrophe
Current status: Houthis have resumed missile strikes on Israel (since March 28), but have not attacked Red Sea shipping. This is deliberate — Iran is holding the Bab al-Mandab strait as a reserve card on its escalation ladder. The Houthi Deputy Information Minister explicitly stated that closing Bab al-Mandab is “an option that can be implemented at any time,” with two triggers: (a) savage escalation against Iran, (b) Gulf state military involvement.
This is the single most important signal in the entire framework. If the Houthis start hitting commercial ships, all other scenarios are void.
Trades:
| Ticker | Direction | Logic |
|---|---|---|
| Crude oil | Parabolic | Dual closure = global daily loss far exceeding 10 million barrels |
| Gold | Long | Safe haven + inflation expectations blow out |
| Global equity indices | Short | Recession risk. Use puts, don’t go naked short |
| Shipping stocks | Explosive rally | Capacity squeezed to the extreme. Shanghai-Genoa rates already +15% last week — that’s the canary |
Invalidation: Ceasefire reached, or Iran explicitly reaffirms control over Houthi operations
The Multipolar Trade: Who Got a Pass?
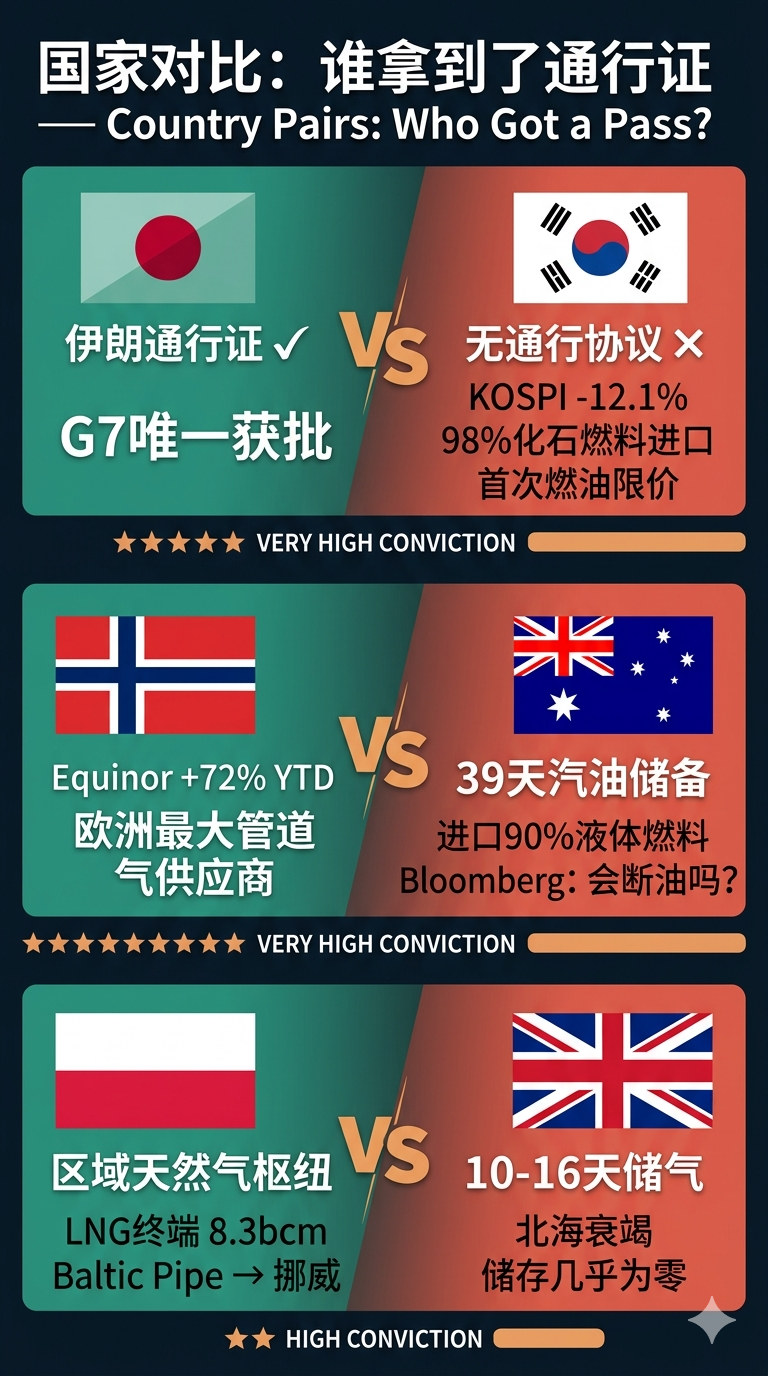
Under the toll-booth model, a country’s energy security is no longer just about reserves — it’s about diplomatic execution. Who got Iran’s approval determines who survives.
| Long | Short | Logic | Conviction |
|---|---|---|---|
| Japan | South Korea | Japan is the only G7 nation with an Iranian transit pass. South Korea imports 98% of fossil fuels, 70% of crude through Hormuz, has no transit deal. KOSPI crashed 12.1% in a single day — worst ever. Fuel price caps imposed for the first time in 30 years. | Very High |
| Norway | Australia | Equinor +72% YTD. Australia imports 90% of liquid fuel, has only 39 days of gasoline reserves. Bloomberg: “Could Australia Run Out of Fuel?” | Very High |
| Poland | UK | Poland is becoming a regional gas hub (LNG terminal expanded to 8.3 bcm/year + Baltic Pipe to Norway). UK gas storage covers just 10-16 days. North Sea production in terminal decline. | High |
This isn’t a conventional macro hedge. This is an entirely new trade logic: whoever has diplomatic access to the toll booth determines national economic resilience.
Three Signals: Your Dashboard
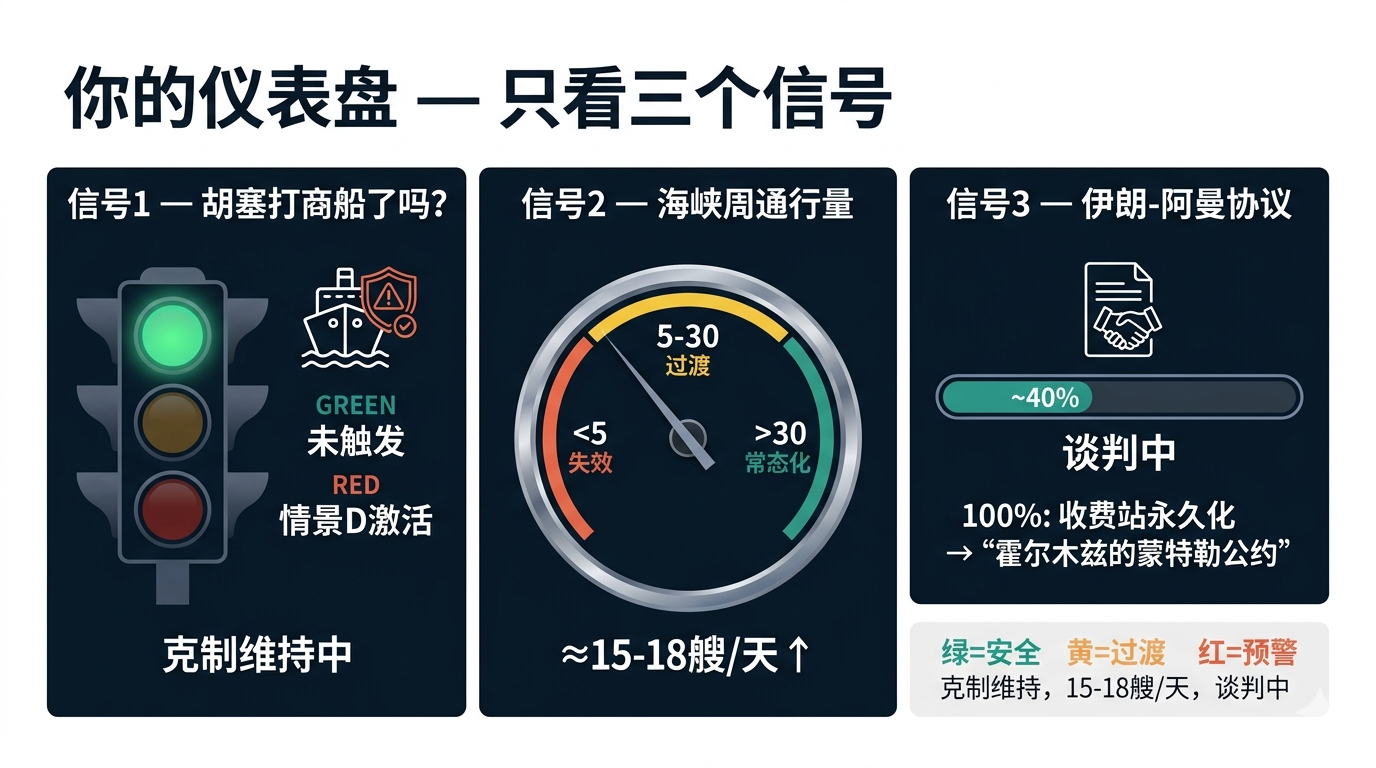
Don’t make decisions based on daily headlines. Watch three things:
Signal 1: Have the Houthis attacked a commercial ship? → If yes: Scenario D activates. This is the highest-priority warning. → Current: No. Restraint holds.
Signal 2: Weekly Hormuz transit count? → If >30/day: Scenario A accelerating. Toll booth is normalizing. → If <5/day: Scenario A fails. Reassess. → Current: ~15-18/day, trending up.
Signal 3: Has the Iran-Oman protocol been formalized? → If yes: The toll booth becomes a permanent institution. Montreux for Hormuz. → Current: Under negotiation. Iranian officials are in Oman discussing governance protocols.
Final Word
On March 3rd, I said the underlying logic of every trade is Hormuz.
37 days later, that’s still true — but the underlying logic itself has changed.
It’s not “open or closed.” It’s “whose rules, whose ships, who pays.”
The world is lining up to adapt to a new reality: the American security umbrella no longer automatically covers everyone, and every country must negotiate its own passage. This isn’t just a byproduct of one war — it’s a live preview of the multipolar world.
The strait didn’t close. It changed management. And the world is already buying tickets.
On March 3rd, I drew a four-row table thinking I could box in reality. Reality spent 37 days teaching me one thing: the most profitable trade is always hiding in the row you didn’t draw.
That row is open now. Are you getting in?
This article is for informational purposes only and does not constitute investment advice.