Apr 6, 2026
The Hidden Inflation: When Missiles Cut Off Fertilizer Routes, Who Feeds the World?
The Strait of Hormuz doesn't just ship oil — 15% of the world's urea and ammonia passes through it too. Full teardown of 10 agricultural stocks: CF Industries highest conviction, Mosaic best deep value, Corteva most defensive.
The Hidden Inflation: When Missiles Cut Off Fertilizer Routes, Who Feeds the World?
“Geopolitical Edge” Investment Series
The Strait of Hormuz doesn’t just ship oil — 15% of the world’s urea and ammonia passes through it too. When a missile shuts down fertilizer shipping lanes, food inflation becomes the second geopolitical bill.
When I first started tracking Hormuz, I was looking at oil prices like everyone else. Then I pulled up the Middle East’s export data and realized something the market was ignoring: Qatar, Saudi Arabia, and Oman aren’t just oil exporters — they’re among the world’s largest nitrogen fertilizer exporters.
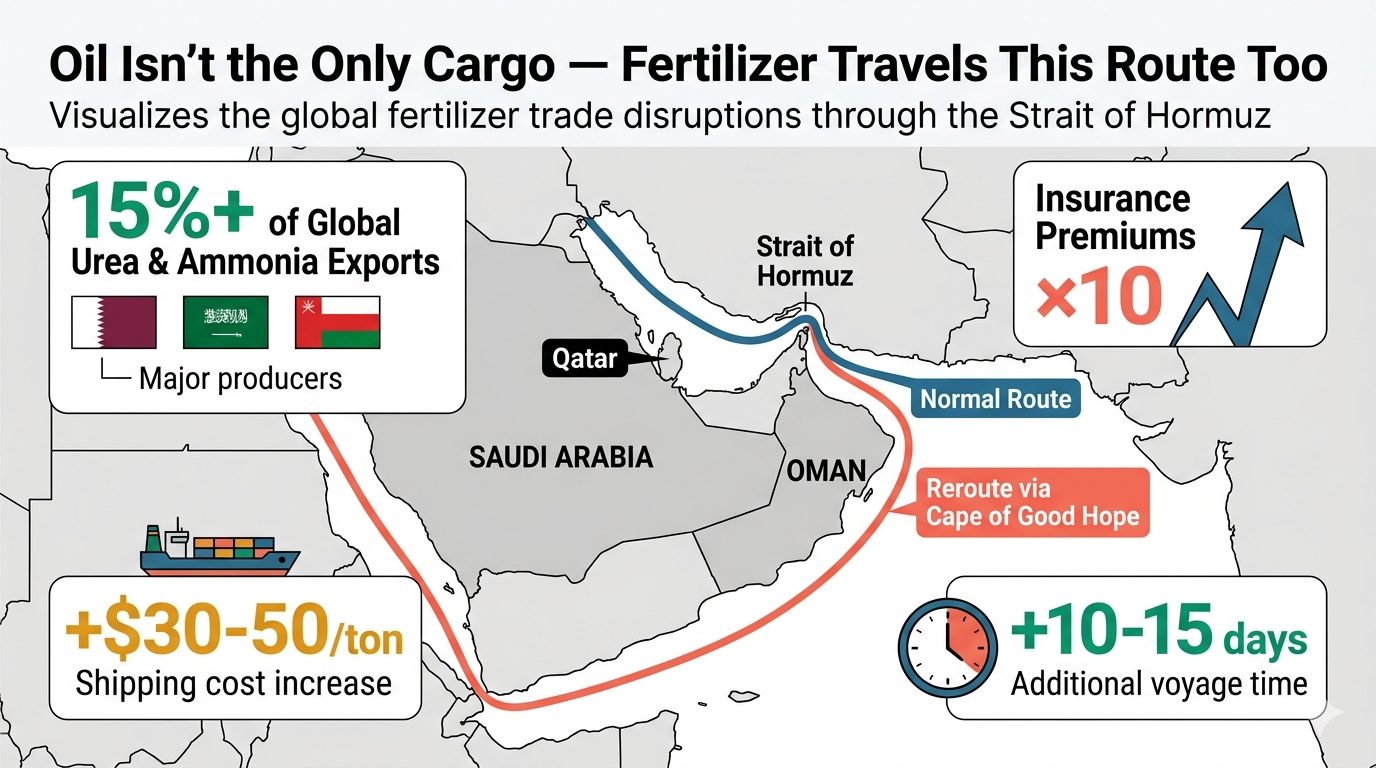
In 2022, sanctions on Belarusian potash wiped out 20% of global supply overnight. Prices surged from $200/ton to $900/ton. In 2026, Operation “Epic Fury” paralyzed Hormuz shipping, and Middle Eastern urea and ammonia — over 15% of global exports — couldn’t get out. Rerouting around the Cape adds $30-50 per ton in freight costs.
The market is watching oil. But fertilizer is the real second-order effect. Fertilizer costs are 30-40% of food production costs. When fertilizer rises, everyone’s grocery bill rises.
When I spread out the numbers on all 10 stocks, one thing surprised me: the quality dispersion in this sector is wider than anything I’ve analyzed. The best company has a 35% operating margin; the worst lost $2.24B. Same sector, worlds apart.
Here’s the full breakdown — potash leaders, nitrogen pure-plays, seed-tech giants, grain traders, and farm equipment titans, all run through the complete toolkit.
TL;DR: - Highest Conviction: CF Industries (CF) — Best quality metrics in the group: 35% operating margin, 23% ROE, fortress balance sheet, U.S. natural gas cost moat, direct beneficiary of Hormuz disruption - Best Deep Value: Mosaic (MOS) — P/B 0.66x (below book value), EV/EBITDA 5.8x (lowest in group), forward P/E 10.2x, implying a major earnings recovery - Most Defensive: Corteva (CTVA) — Net cash, stable revenue, 47% gross margin (seed IP pricing power), beat estimates 4 consecutive quarters - Best Risk/Reward: Nutrien (NTR) — World’s largest potash producer, 2.91% dividend, geopolitical catalyst directly benefits Canadian supply security - Highest Strategic Optionality: Intrepid Potash (IPI) — The only U.S. potash producer, zero debt, but micro-cap with the stock already doubled
Three Forces Driving Agricultural Inflation
Force 1: Hormuz — The Overlooked Fertilizer Chokepoint
Everyone’s talking about oil. But the Strait of Hormuz is also a critical node in the global fertilizer supply chain:
- The Middle East produces 15%+ of global urea and ammonia exports — Qatar, Saudi Arabia, Oman, and Iran itself are all major nitrogen fertilizer producers
- After Operation “Epic Fury,” Persian Gulf shipping insurance premiums surged 10x — commercial vessels are actively avoiding the strait
- Rerouting via the Cape of Good Hope adds 10-15 days of transit time — adding $30-50 per ton in fertilizer freight costs
- This isn’t a temporary disruption — there’s no sign of a quick resolution to the Iran situation, and shipping reroutes could persist for months or years
- Europe and Asia are the biggest losers — they’re heavily reliant on Middle Eastern nitrogen imports; North American producers are least affected
- The 2024 Red Sea/Houthi crisis already proved — once shipping reroutes begin, they become self-reinforcing (insurance costs, fleet reallocation, contract renegotiation)
Strategic logic: Whoever produces fertilizer in North America holds a free ticket to premium pricing. CF Industries and Nutrien are the biggest beneficiaries.
Force 2: Post-Russia/Belarus Sanctions — A Permanent Scar on Potash Supply
The 2022 sanctions didn’t fully disappear — they left structural supply gaps:
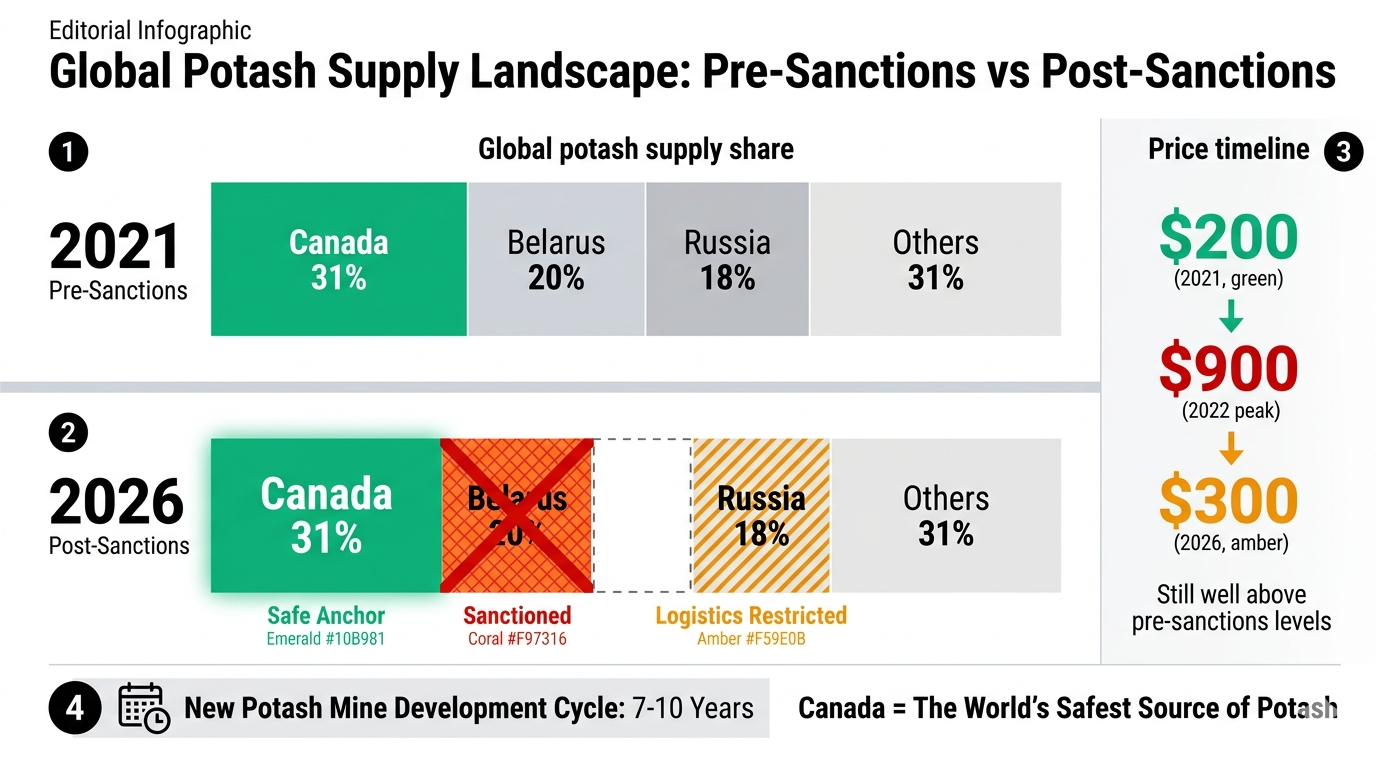
- Belarus (Belaruskali) once accounted for 20% of global potash exports — post-sanctions, export volumes still haven’t recovered to 2021 levels
- Russia (Uralkali + PhosAgro) continues to export but faces logistics constraints, financial sanctions, and voluntary buyer boycotts
- Canada (Nutrien + Mosaic) has become the world’s safest potash source — zero sanctions risk, zero geopolitical risk
- Potash prices pulled back from the $900/ton peak to around $300/ton — but still well above the pre-sanctions $200/ton level
- New potash mines take 7-10 years from discovery to production — supply-side can’t respond quickly
- New African projects (Congo, Ethiopia) are progressing slowly — inadequate infrastructure, high political risk
Strategic logic: The global potash supply chain has been permanently reshaped by geopolitics. North American producers enjoy a structural premium.
Force 3: Structural Food Demand Growth vs. Declining Arable Land
Even without geopolitical catalysts, long-term demand for agricultural inputs is rising:
- Global population exceeds 8.5 billion by 2030 — more people means more food demand
- Protein transition — rising meat consumption in developing nations drives feed grain demand (1 kg of meat requires 3-8 kg of grain)
- Global arable land is stagnating or shrinking — urbanization, soil degradation, and climate change compress available farmland
- Yield growth is decelerating — the Green Revolution’s marginal returns are diminishing; maintaining output requires more fertilizer and seed technology
- Climate volatility is intensifying — extreme weather events (droughts, floods) increase yield uncertainty and grain price volatility
- Biofuel mandates — 40% of U.S. corn goes to ethanol production, persistently squeezing food supply
Strategic logic: This is a long-term supply-demand imbalance. Short-term, there’s a geopolitical catalyst. Long-term, population growth and shrinking farmland provide fundamental support.
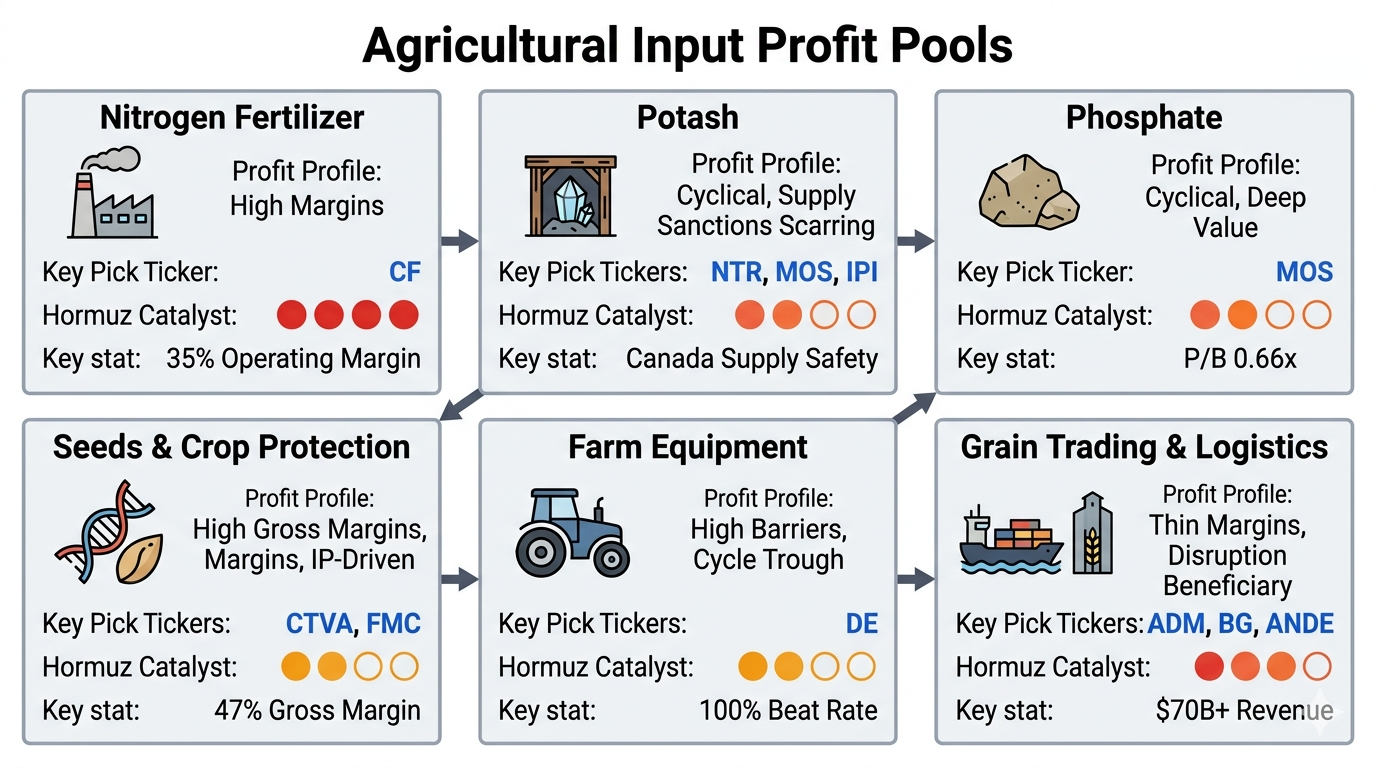
Where the Money Is: Agricultural Input Profit Pools
| Subsector | Profit Profile | Key Tickers | Hormuz Catalyst Impact |
|---|---|---|---|
| Nitrogen Fertilizer | High margins, U.S. natural gas cost advantage | CF | Very high — Middle East urea exports disrupted, directly benefits U.S. nitrogen |
| Potash | Cyclical, permanent supply scar from sanctions | NTR, MOS, IPI | High — North American supply security premium |
| Phosphate | Cyclical, deep value | MOS | Medium-high — phosphate rock supply concentrated in Morocco/China |
| Seeds & Crop Protection | High gross margins, IP-driven | CTVA, FMC | Medium — rising grain prices drive farmers to increase inputs |
| Farm Equipment | High barriers, cyclical trough | DE | Medium — precision agriculture as a long-term trend |
| Grain Trading & Logistics | Thin margins, high volumes, supply-chain disruption beneficiary | ADM, BG, ANDE | High — trade route restructuring benefits large traders |
Power Rankings: Full Analysis of 10 Agricultural & Food Security Stocks
Tier 1: Core Holdings
CF Industries — CF | $136.45 | Market Cap: $20.97B
Best Quality Metrics in the Group — America’s Nitrogen King
| Metric | Value | Signal |
|---|---|---|
| P/E (TTM) | 15.2x | Reasonable |
| Forward P/E | 17.9x | Slightly rich — market expects earnings pullback |
| EV/EBITDA | 7.9x | Mid-range |
| Gross Margin | 38.5% | Best in group |
| Operating Margin | 35.3% | Best in group, crushes peers |
| Net Margin | 20.5% | Industry-leading |
| ROE | 23.4% | Best in group |
| FCF Yield | 6.24% | Attractive |
| Cash | $1.98B | Fortress-grade |
| D/E Ratio | 46.8 | Manageable |
| Current Ratio | 3.37 | Excellent |
| Dividend Yield | 1.47% | Conservative, buyback-focused |
| Beta | 0.69 | Low volatility |
| Analyst Consensus | Hold, $112.32 | Market sees it as fully priced |
Bull Case: This is the “quality monopolist” of the ag sector. A 35% operating margin in the fertilizer industry is virtually unheard of — 3x higher than second-place Nutrien. Why? The U.S. natural gas cost advantage. Natural gas represents 60% of nitrogen fertilizer production costs, and U.S. Henry Hub prices are consistently one-third of European TTF prices. If Hormuz disruption blocks Middle Eastern urea exports, CF is the most direct replacement supplier. $1.98B in cash, conservative dividends (22% payout ratio), aggressive buybacks. Revenue re-accelerated in 2025 (+22.8% YoY). Beat estimates in 3 of the last 4 quarters.
Bear Case: Trading near its 52-week high, approaching all-time highs. Forward P/E exceeding trailing P/E signals Wall Street expects earnings to decline from current levels. Nitrogen is the most commoditized fertilizer subsector. A natural gas price spike would compress margins. Analyst target of $112 is 18% below current price — the Street thinks it’s run too far.
Verdict: Highest Conviction. Quality is the ultimate moat. 35% operating margin + 23% ROE + fortress balance sheet + U.S. natural gas cost advantage + Hormuz catalyst = best risk-adjusted return in the group. The only issue is entry price — building a position below $120 is more ideal.
But here’s the question that nagged me after digging through CF’s numbers: what if natural gas suddenly spikes to $6? CF’s moat cracks. Is there a stock in this group that you don’t have to worry about regardless of whether fertilizer prices rise, gas prices spike, or Hormuz reopens?
There is. And it doesn’t even sell fertilizer.
Corteva — CTVA | $81.99 | Market Cap: $55.14B
Seed IP Pricing Power — Agriculture’s Hidden Champion
| Metric | Value | Signal |
|---|---|---|
| P/E (TTM) | 46.9x | Expensive — but for a reason |
| Forward P/E | 20.3x | Reasonable — massive earnings growth expected |
| EV/EBITDA | 14.2x | Upper-mid |
| Gross Margin | 47.3% | Highest in group |
| Operating Margin | 5.6% | Thin — R&D-heavy |
| Net Margin | 6.3% | Moderate |
| ROE | 5.0% | Low (high equity base) |
| FCF Yield | 5.31% | Attractive |
| Net Cash | $4.53B cash vs $3.00B debt | Net cash |
| D/E Ratio | 12.3 | Lowest in group |
| Current Ratio | 1.43 | Solid |
| Dividend Yield | 0.88% | Low |
| Beta | 0.72 | Low volatility |
| Analyst Consensus | Buy, $83.95 | Roughly at target |
Bull Case: Corteva isn’t a commodity company — it’s an IP company. The 47% gross margin comes from seed patent and crop protection formulation pricing power. Look at four years of revenue: $17.45B, $17.23B, $16.91B, $17.40B. Nearly a perfect straight line. This is the only company in the group completely immune to commodity cycles. Net cash position, lowest leverage in the group, beat estimates 4 quarters running. Hormuz disruption doesn’t directly impact Corteva (it doesn’t sell fertilizer), but rising grain prices drive farmers to spend more on seeds and crop protection — an indirect beneficiary. The next-generation drought-resistant and pest-resistant seed R&D pipeline is the long-term growth engine.
Bear Case: 47x trailing P/E is the most expensive in the group. Revenue hasn’t grown in four years. Dividend yield is under 1%. Operating margin of only 5.6% (R&D-heavy) means execution risk is higher than the margin figures suggest.
Verdict: Most Defensive. If you could only buy one stock in this sector and never worry about it, it’s CTVA. Net cash, stable revenue, IP moat, low volatility. The only drawback is valuation — but quality is never cheap.
So we’ve found the highest-quality name and the safest name. But if you want to bet directly on the Hormuz story — who sits at the epicenter of the geopolitical catalyst?
Nutrien — NTR | $75.65 | Market Cap: $36.59B
World’s Largest Potash Producer — Core Beneficiary of Geopolitical Catalysts
| Metric | Value | Signal |
|---|---|---|
| P/E (TTM) | 16.2x | Reasonable |
| Forward P/E | 15.6x | Slight growth implied |
| EV/EBITDA | 8.8x | Mid-range |
| Gross Margin | 32.2% | Solid |
| Operating Margin | 12.7% | Recovering |
| Net Margin | 8.7% | Positive |
| ROE | 9.2% | Recovering |
| FCF Yield | 3.71% | Moderate |
| Cash | $0.70B | |
| Total Debt | $12.02B | On the high side |
| Current Ratio | 1.34 | Adequate |
| Dividend Yield | 2.91% | Attractive |
| Beta | 1.17 | Slightly elevated |
| Analyst Consensus | Buy, $78.00 | 3% upside |
Bull Case: World’s largest potash producer + 2,000 retail locations = an irreplicable moat. Saskatchewan’s potash mines are among the lowest-cost in the world. After Russia/Belarus sanctions, Nutrien’s potash commands a structural supply-security premium. The retail distribution network generates recurring revenue and customer stickiness. A 2.91% dividend provides downside protection. Net income jumped from $0.67B to $2.27B in 2025 — earnings recovery is clear.
Bear Case: Revenue remains well below the 2022 peak of $37.88B. $12B in debt is the highest absolute figure in the group. Quick ratio of 0.58 is thin. Analyst target of $78 implies only 3% upside — limited near-term room. Earnings beats over the last 4 quarters have been inconsistent (2 beats, 2 misses).
Verdict: Best Risk/Reward. Global potash leader + Canadian supply security + dividend anchor + earnings recovery. Not the cheapest and not the most expensive, but the most balanced on a risk-adjusted basis.
Tier 2: Opportunistic Positions
The three above are the close-your-eyes-and-hold core positions. The next four are different — each one is a bet on something specific happening. Get it right and you’ll outperform the core names; get it wrong and you’ll feel it.
Mosaic — MOS | $25.00 | Market Cap: $7.94B
Cheapest in the Group — A Phosphate-Potash Dual Play Trading Below Book
| Metric | Value | Signal |
|---|---|---|
| P/E (TTM) | 14.7x | Cheapest among profitable names |
| Forward P/E | 10.2x | Significant earnings growth expected |
| EV/EBITDA | 5.8x | Lowest in group |
| P/B | 0.66x | Below book value |
| Gross Margin | 15.8% | Cyclical trough |
| Net Margin | 4.5% | Thin but positive |
| FCF Yield | -5.46% | Negative — capex-heavy |
| Dividend Yield | 3.52% | Highest in group |
| D/E Ratio | 43.2 | Moderate |
| Analyst Consensus | Hold, $31.27 | 25% upside |
Bull Case: When I first pulled up MOS’s numbers, I thought I had the wrong row. Every valuation metric screams “cheap”: P/B of 0.66x means you’re buying $1 of assets for 66 cents. EV/EBITDA of 5.8x is the lowest in the group. Forward P/E of 10.2x implies Wall Street expects a major earnings acceleration. As a domestic U.S. phosphate + potash dual producer, Mosaic directly benefits from the North American supply-security theme. The 3.52% dividend yield is the highest in the group. Analyst target of $31.27 implies 25% upside — the largest consensus upside in the group.
Bear Case: FCF is negative (-$0.43B), meaning capex is consuming cash. Gross margin of 15.8% is the weakest among profitable names. $0.28B cash against $5.28B debt — a thin buffer. High payout ratio (51.8%) combined with negative FCF raises dividend sustainability questions.
Verdict: Best Deep Value. Buying an irreplaceable phosphate-potash asset portfolio below book value. The risk is the timing of FCF recovery — if fertilizer prices don’t rise, deep value could turn into a value trap. Averaging in around $22 is safer.
MOS is a bet on fertilizer prices. But what if you want to bet not on the price cycle, but on agriculture’s entire technological transformation?
Deere — DE | $566.64 | Market Cap: $153.05B
King of Precision Agriculture — Transforming from Cyclical Equipment Maker to Tech Platform
| Metric | Value | Signal |
|---|---|---|
| P/E (TTM) | 31.9x | Premium |
| Forward P/E | 24.5x | Still on the pricey side |
| EV/EBITDA | 24.6x | Most expensive in group |
| Gross Margin | 26.2% | Solid |
| Net Margin | 10.3% | Healthy |
| FCF | $4.20B | Strong |
| ROE | 19.6% | Strong |
| D/E Ratio | 239.6 | Includes financial services subsidiary — not directly comparable |
| Consecutive Beats | 4/4 quarters | 100% beat rate |
| Analyst Consensus | Buy, $658.58 | 16% upside |
Bull Case: A 100% earnings beat rate — tied for the best execution in the group. Deere doesn’t just sell tractors — See & Spray technology (precision application, reducing herbicide use by 85%) and autonomous tractors are transforming the company from a cyclical equipment maker into a recurring-revenue tech platform. Global food security imperatives drive long-term farm equipment capex. $4.2B in FCF supports buybacks and dividends. Analysts project 16% upside.
Bear Case: The most expensive stock in the group on every valuation metric. Revenue has declined from a $60.25B peak to $44.66B — the farm equipment cycle is still in a downturn. D/E of 239.6 (including financial services subsidiary). Premium valuation leaves little margin of safety.
Verdict: Premium Play. Deere is the stock you pay up for quality and long-term structural growth. A 100% beat rate proves flawless execution, but an EV/EBITDA of 24.6x means you should wait for a pullback. The $480-500 range is a better entry zone.
DE is a bet on farming’s future. The next two are bets on the present — global grain routes are being redrawn by missiles, and whoever moves the grain collects the toll.
Bunge Global — BG | $128.72 | Market Cap: $24.91B
The New Global Grain Trading Powerhouse Post-Viterra Merger
| Metric | Value | Signal |
|---|---|---|
| P/E (TTM) | 26.1x | Elevated |
| Forward P/E | 12.7x | Cheap — merger synergies priced in |
| P/S | 0.35x | Lowest in group |
| Gross Margin | 4.8% | Lowest in group |
| Net Margin | 1.2% | Thin-margin, high-volume |
| FCF | -$7.11B | Acquisition cash outflow |
| Dividend Yield | 2.18% | Moderate |
| D/E Ratio | 91.0 | Elevated post-acquisition |
| Consecutive Beats | 4/4 quarters | 100% beat rate |
| Analyst Consensus | Strong Buy, $132.50 | Strongest consensus in group |
Bull Case: I’ll be honest — BG is the one I agonized over most in this group. The Viterra merger created the world’s largest agricultural conglomerate by revenue ($70B+). Scale is the moat in grain trading — more origin-point access, more logistics networks, more arbitrage opportunities. 100% earnings beat rate. Forward P/E of 12.7x is cheap for a global champion that just completed a transformative acquisition. Supply-chain disruptions (Hormuz, Black Sea) directly benefit large trading houses — they profit from arbitrage spreads. Strong Buy is the highest analyst consensus in the group.
Bear Case: Integration risk — Viterra was an $8.2B acquisition. Debt nearly doubled. Thinnest margins in the group (1.2% net margin). 2025 FCF is negative (acquisition cash outflow). Needs successful integration to support the current stock price.
Verdict: High Conviction, But Requires Patience. If the Viterra integration goes well, BG becomes the undisputed leader in global grain trading. But integration risk is real. Best suited for investors bullish on the agricultural supply-chain restructuring theme.
ADM — Archer-Daniels-Midland | $72.23 | Market Cap: $34.81B
An ABCD Grain Trader — Value Recovery Meets Supply-Chain Disruption
| Metric | Value | Signal |
|---|---|---|
| P/E (TTM) | 32.4x | Elevated (earnings trough) |
| Forward P/E | 15.2x | Reasonable — earnings recovery expected |
| Gross Margin | 6.3% | Thin-margin, high-volume |
| Net Margin | 1.3% | Very thin |
| FCF Yield | 6.17% | Attractive |
| Dividend Yield | 2.88% | Solid |
| Consecutive Beats | 4/4 quarters | 100% beat rate |
| Analyst Consensus | Hold, $62.64 | 13% below current price |
Bull Case: ADM’s story isn’t sexy, but the numbers are interesting. One of the “ABCD” Big Four grain trading firms, with irreplaceable global logistics infrastructure (ports, warehouses, transportation networks). Hormuz disruption reroutes grain trade, benefiting trading desks with global arbitrage capabilities. 100% beat rate. 6.17% FCF yield and 2.88% dividend yield provide a value anchor. The 2024 accounting scandal created a sentiment discount — likely an overreaction.
Bear Case: Analyst target of $62.64 is 13% below current price — the Street thinks the recovery is already fully priced. A 1.3% net margin leaves almost no room for error. A 91.5% payout ratio is unsustainable. The 2024 accounting issues damaged credibility.
Verdict: Income-Oriented Holding. 6.17% FCF yield + 2.88% dividend + irreplaceable logistics infrastructure = suitable for investors seeking yield and geopolitical hedging. But don’t expect significant capital appreciation.
Tier 3: Special Situations
The last three gave me pause — they’re not core-position material. But each has a unique asymmetric angle worth keeping on the radar.
| Name | Price / Mkt Cap | Core Bet | Key Metrics | Biggest Risk | Verdict |
|---|---|---|---|---|---|
| FMC $15.76 | $1.97B | Turnaround: fwd P/E 7x + P/B 0.95x, worst-case may be priced in | Gross margin 33.8%, but D/E 200%, net loss $2.24B | Value trap — 3 years of revenue declines, only 1 analyst rates Buy | Watch. Cheap ≠ safe. Wait for D/E below 100% |
| IPI $46.52 | $0.62B | Strategic option: only U.S. potash producer, zero debt, acquisition target | Current ratio 4.38 (best in group), but fwd P/E 74.7x | Narrative priced in — sole analyst target $25, 46% below current | <2% position. Call option on acquisition or policy catalyst |
| ANDE $73.19 | $2.49B | Infrastructure rerating: Midwest grain storage/handling, irreplaceable physical assets | P/S 0.23x (lowest in group), gross profit stable at $0.68-0.75B over 4 years | Low quality — 0.9% net margin, negative FCF, no pricing power | Watch. Wait for FCF to turn positive, cap at 5% |
What these three share: each is a bet on a specific event (FMC turnaround, IPI acquisition, ANDE rerating). If the event doesn’t happen, it’s dead money. Size accordingly, or wait for a signal.
Variant View
Market consensus: Agricultural stocks are boring cyclicals. The 2022 fertilizer spike was a one-off event, prices have normalized, and there’s no catalyst for the sector.
My view: The market treated 2022 as an “anomaly.” It wasn’t. It was the watershed moment when global fertilizer supply chains shifted from “free-flowing” to “geopolitically priced.” The 2022 Russia/Belarus sanctions knocked out 20% of potash supply — prices still haven’t returned to pre-sanction levels. The 2026 Hormuz disruption knocked out 15% of nitrogen fertilizer shipping routes. Two supply shocks stacked together have transformed North American fertilizer producers from “cyclical commodity suppliers” into “geopolitically protected strategic assets.”
Why the market is wrong: 1. Analysts are still using cycle-mean-reversion models — their models assume fertilizer prices revert to “historical averages,” but those averages were built on a supply chain that no longer exists 2. CF Industries’ 35% operating margin is misunderstood — this isn’t a cycle peak; it’s the structural cost advantage of U.S. natural gas vs. European gas. As long as HH stays at $2-3, this margin is the new normal 3. Seed tech’s IP nature is being ignored — Corteva’s 47% gross margin isn’t commodity-style pricing; it’s patent-style IP pricing. The market lumps it into “agriculture” and discounts it accordingly — a classification error
6 Investment Philosophy Perspectives
| Perspective | Verdict | Core Reasoning | Key Risk |
|---|---|---|---|
| 🏦 Quality Compounding (Buffett/Munger) | LONG CF + CTVA | CF’s 35% operating margin + 23% ROE is unprecedented in fertilizer. CTVA’s seed IP pricing power = consumer-grade moat. Both are 10-year holds | Nat gas spike compresses CF margins; CTVA R&D pipeline failure |
| 🚀 Imagination Growth (Baillie Gifford) | LONG DE | Precision ag (autonomous tractors + AI spraying) transforms Deere from equipment maker to agricultural data platform. See & Spray cuts 85% of herbicide use = industry-changing tech | Farmers reject subscription model; tech transformation slower than expected |
| 📈 Fundamental Long/Short (Tiger Cubs) | LONG MOS | P/B 0.66x, EV/EBITDA 5.8x — buying $1 of assets for 66 cents at cycle trough. Forward P/E 10.2x says the Street already sees the earnings inflection | FCF stays negative; fertilizer prices decline further |
| 💎 Deep Value (Klarman) | LONG NTR, WATCH FMC | NTR’s 2,000 retail locations = irreplaceable physical moat + 2.91% dividend. FMC’s 7x forward P/E is tempting but D/E 200% is too dangerous | NTR’s $12B debt strains in rising-rate environment; FMC is a value trap |
| ⚡ Catalyst-Driven (Tepper/Ackman) | LONG BG | Viterra integration completion = birth of world’s largest agribusiness. Strong Buy consensus. 12.7x forward P/E is too cheap for a transformational acquisition | Integration failure; synergies disappoint |
| 🌍 Macro Tactical (Druckenmiller) | LONG the sector | Hormuz disruption is a real supply shock. Rising food prices benefit the entire ag input chain. This isn’t speculation — it’s genuine supply/demand imbalance | Hormuz reopens quickly; global recession crushes food demand |
6/6 perspectives are LONG (on different names) — every framework points to a different optimal pick, but the direction is unanimous: long agriculture.
Pre-Mortem: If We Lose Money in 2 Years
Failure Path A (est. 25% probability): Hormuz Reopens + Sanctions Ease - Iran situation unexpectedly stabilizes, Hormuz fully reopens. Simultaneously, Russia/Belarus sanctions partially lifted, Belarusian potash returns to market - Fertilizer prices fall back to 2020 levels, North American producers’ “geopolitical premium” evaporates - CF/NTR/MOS earnings decline sharply, multiples compress - Early warning: Persian Gulf shipping insurance rates fall back to pre-conflict levels; Belarusian potash exports grow for 2 consecutive quarters
Failure Path B (est. 15% probability): Global Recession - Deep recession suppresses food demand and farmer purchasing power, fertilizer usage declines - Deere equipment orders continue deteriorating. BG’s Viterra integration faces demand headwinds - Entire sector derated 20-30% - Early warning: FAO food price index drops below 100; U.S. farm income negative for 2 consecutive quarters
Failure Path C (est. 10% probability): Natural Gas Price Spike - LNG export restrictions or supply shock pushes HH natural gas above $6 - CF’s core competitive advantage (low-cost gas) erodes, operating margin compresses from 35% to 15-20% - This is CF-specific risk, doesn’t affect NTR/CTVA - Early warning: HH natural gas breaks above $5 and holds for 2+ weeks
Action Triggers
| Signal | Action | Ticker |
|---|---|---|
| Potash price breaks above $350/ton | Add to position | NTR, MOS |
| CF pulls back to below $120 | Initiate or add | CF |
| DE pulls back to $480-500 | Initiate position | DE |
| MOS drops below $22 (near 52W low) | Deep value add | MOS |
| BG announces Viterra synergies ahead of plan | Add to position | BG |
| HH natural gas breaks above $5 | Trim CF, rotate to CTVA | CF → CTVA |
| Belarusian potash exports grow consecutively | Trim | NTR, MOS |
| FAO food price index drops below 100 | Broad trim | All sector |
| Hormuz insurance rates fall to pre-conflict levels | Reassess entire thesis | All sector |
Portfolio Construction Guide
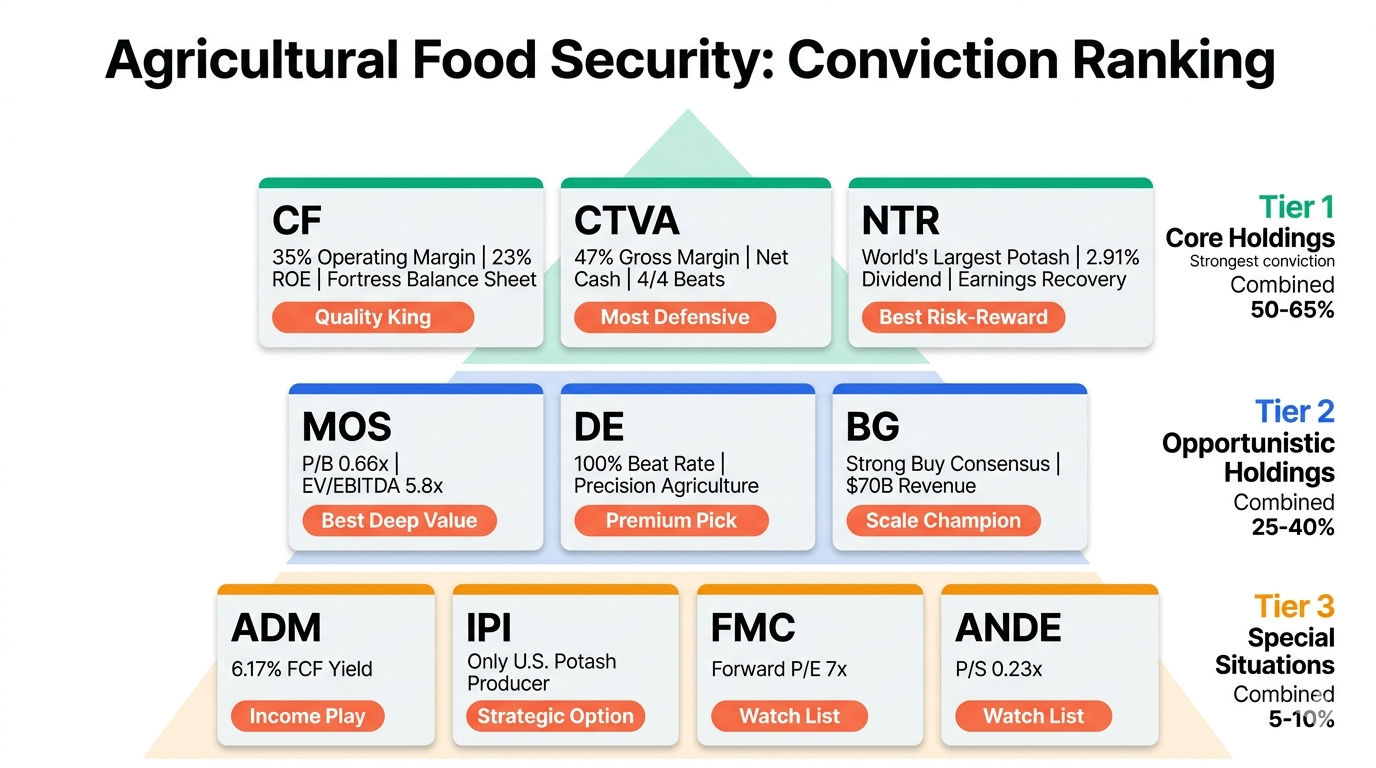
Core (55-65%): CF 20-25% | CTVA 15-20% | NTR 15-20% Opportunistic (25-40%): MOS 10-15% | DE 10-15% | BG 5-10% Satellite (<10%): ADM 5% | IPI 2-3% Watch List: FMC (await D/E improvement) | ANDE (await positive FCF)
Key Signals to Monitor
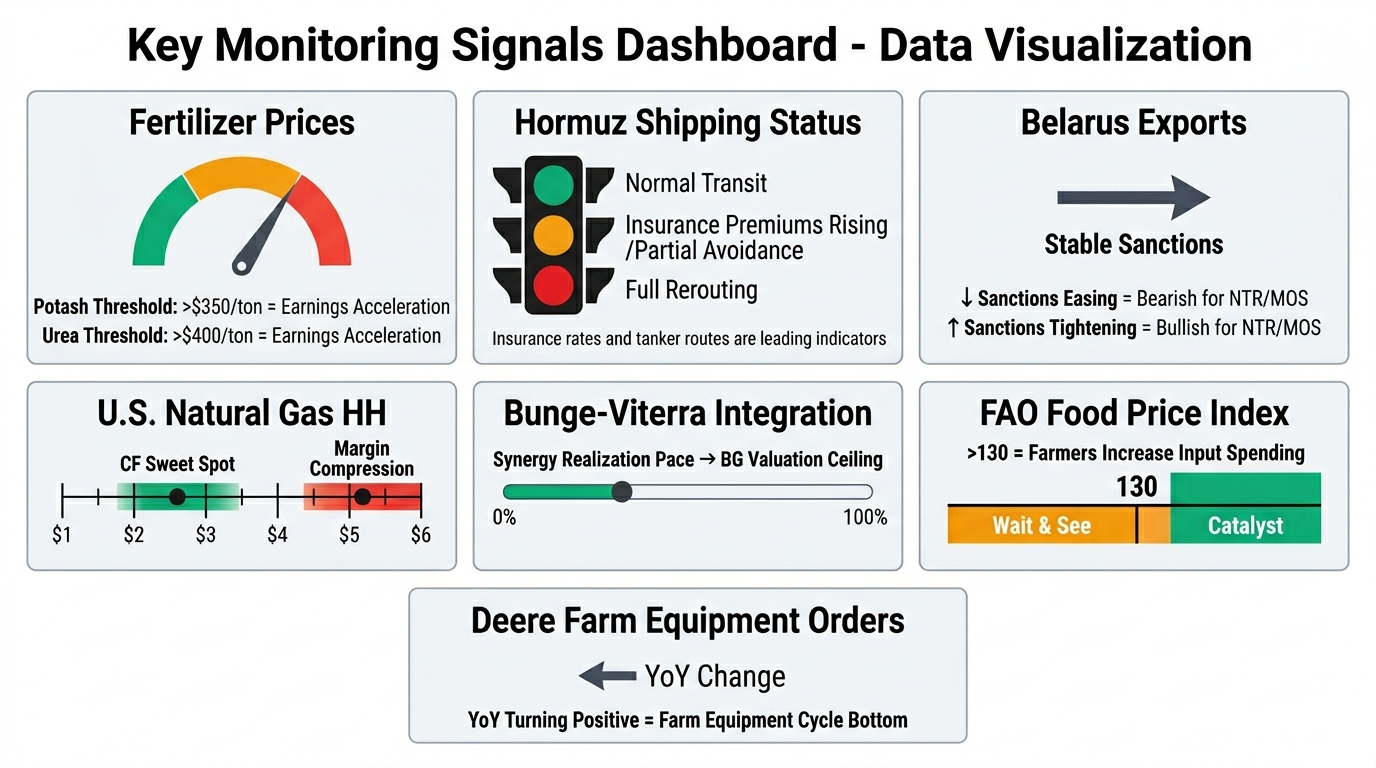
- Fertilizer Prices — Potash above $350/ton, urea above $400/ton marks the inflection point for earnings acceleration
- Hormuz Shipping Status — Insurance rates and tanker routing are leading indicators
- Belarusian Export Data — Sanctions easing = bearish for NTR/MOS; continuation = bullish
- U.S. Natural Gas Prices (HH) — The $2-3 range is CF’s sweet spot; above $5 starts compressing margins
- Bunge-Viterra Integration Progress — The pace of synergy realization determines whether BG breaks through its valuation ceiling
- Global Food Price Index (FAO) — Levels above 130 drive farmers to increase input spending
- Deere Equipment Orders — A YoY turn to positive = signal that the farm equipment cycle has bottomed
Data as of: March 29, 2026. All valuations based on closing prices that day. Fundamental data sourced from Yahoo Finance / Financial Modeling Prep.
Disclaimer: This article is for educational and research purposes only and does not constitute investment advice. The author may hold positions in some of the securities mentioned.