Apr 30, 2026
Big Tech Q1 2026 Earnings: $700B AI Capex Arms Race — Why Only One Got Market Credit
Four tech giants reported Q1 2026 the same night — Alphabet, Microsoft, Amazon, Meta — and the market gave four wildly different verdicts on their combined $700B AI capex bet. Here's why only Google got initial credit, why AMZN got bid back the day after, and what to do.
Big Tech Q1 2026 Earnings Deep Dive
$700B AI Capex Arms Race — The Market Only Cheered for One
A Scene First
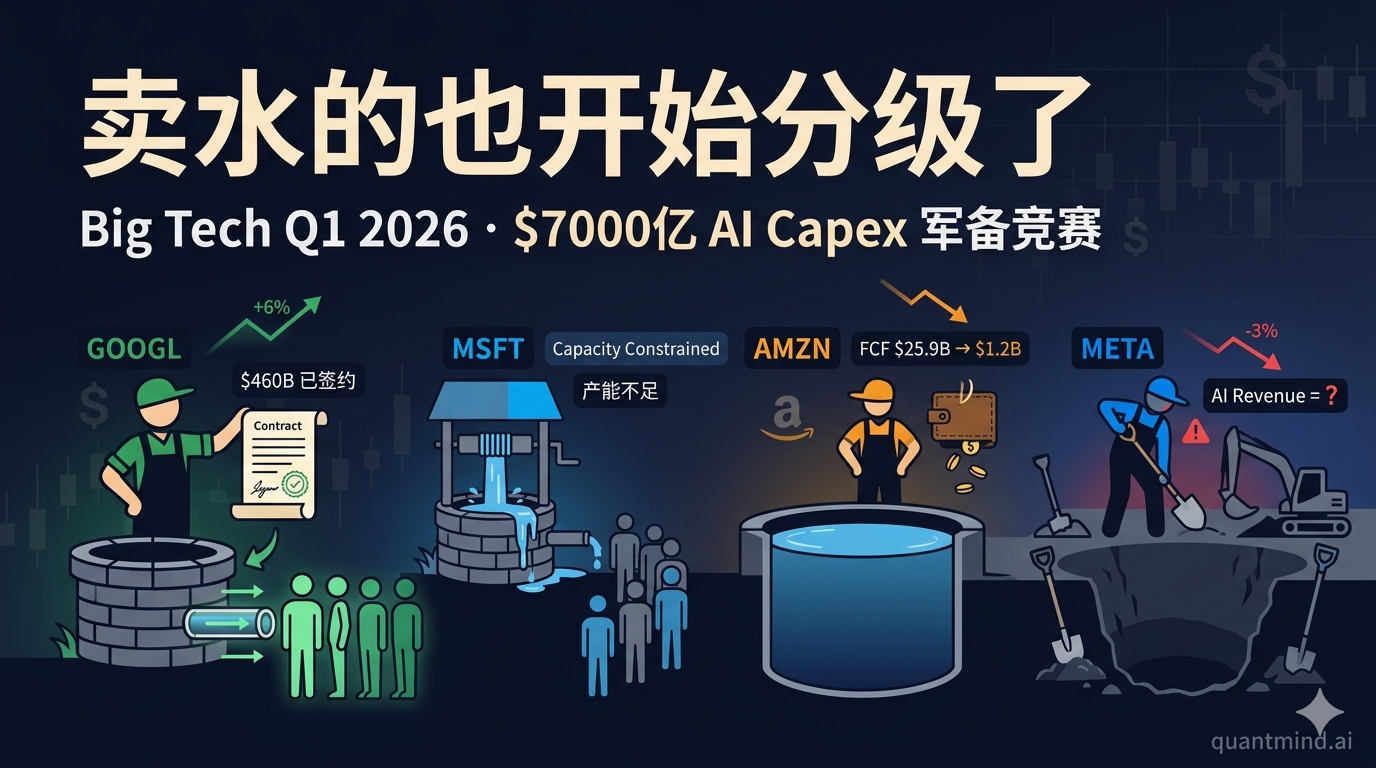
Tonight, in the 30 minutes after 4:30 PM ET, I had four browser tabs open and kept refreshing — GOOGL +6%, META −3%, MSFT hovering near zero, AMZN bouncing +1% / −1% / +1%. Same night, same industry, same narrative — AI capex — and the market gave four wildly different answers.
This isn’t coincidence. This is the first time in two years the market started scrutinizing each company’s capex ROI individually.
TL;DR
GOOGL +6% AH, META down, MSFT slight dip; AMZN initially −3% AH but bid back the next day — recovered above the prior $263 close intraday on 4/30. Four giants reported, market reactions diverged, and the day-after narrative pulled AMZN back into the winners’ camp.
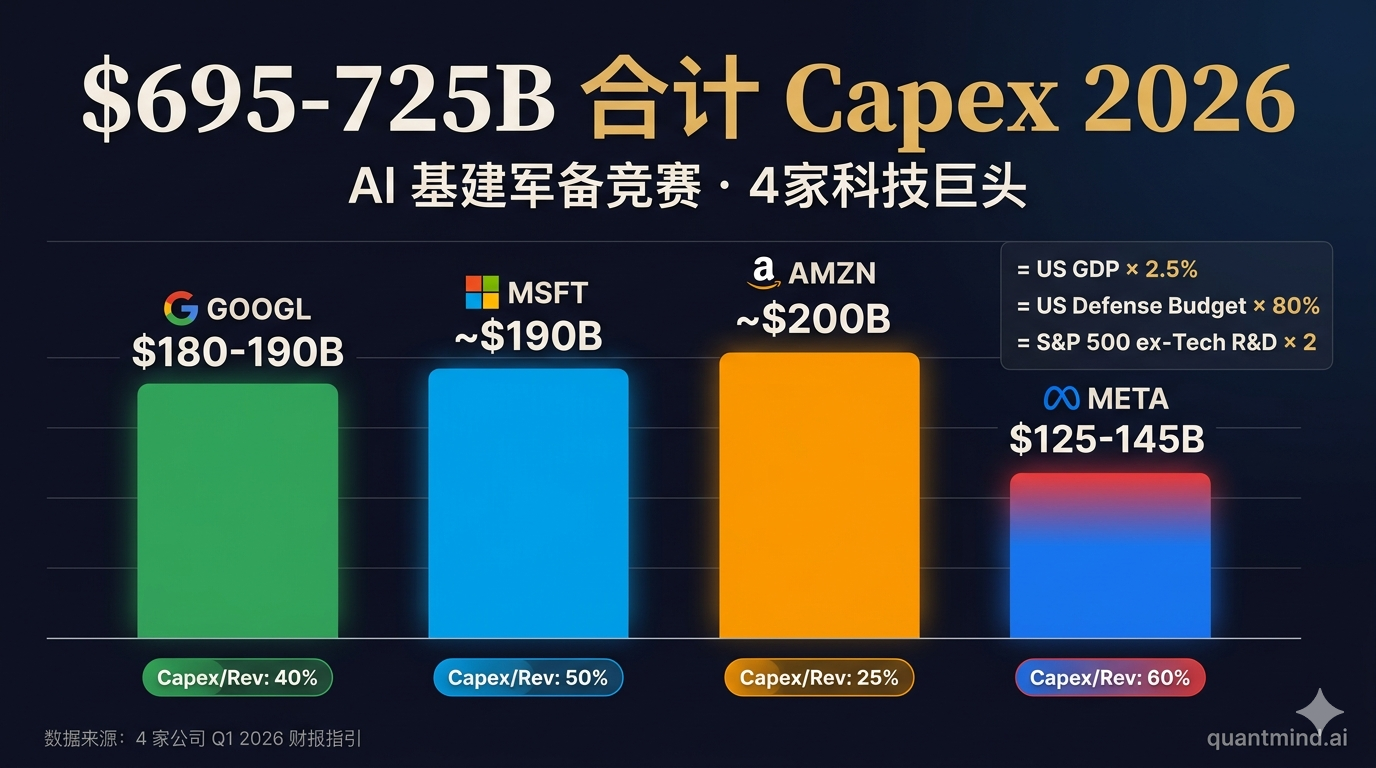
Combined 2026 capex guides land around $695-725 billion — equivalent to 2.5% of US GDP, 80% of the US defense budget, or 2× the entire S&P 500 ex-tech R&D spend, in one year, on AI infrastructure. Only one company spelled out where the money goes, when, and how it becomes revenue.
| Ticker | Verdict | One-line reason |
|---|---|---|
| GOOGL | Long (core position) | $460B Cloud backlog doubled QoQ — only hard data point on the field |
| MSFT | Long (wait for pullback) | OpenAI deal restructure unlocks long-term margin, but Q3 capacity-bottlenecked |
| AMZN | Long-observe (day-after rebid) | AWS 15-quarter high + 4/30 intraday recovered above $263, market swallowed the FCF vacuum |
| META | PASS / trim candidate | Capex/Revenue near 60%, no separate AI revenue disclosure |
If you only remember one line: “AI capex is the bet. Monetization is the payoff. Tonight only Google showed the receipt.”
Key Force: $700B Combined Capex, But Market No Longer “Bundling Credit”
For two years the market treated the four mega-caps as one “AI infrastructure ETF” — whoever raised capex saw their stock rise. Tonight that consensus broke for the first time.
Combined 2026 AI Capex:
| Company | 2026 Capex Guide | This Quarter Change | % of Revenue |
|---|---|---|---|
| GOOGL | $180-190B | Raised (from $175-185B) | ~40% |
| MSFT | ~$190B | Raised (vs $154.6B consensus, +$35B) | ~50% |
| AMZN | ~$200B | Maintained / implicit raise | ~25% |
| META | $125-145B | Raised (from $115-135B) | ~60% |
| Total | $695-725B | All raised | — |
The pivot was the market reaction:
- GOOGL +6% AH, new all-time high near $367
- MSFT mixed — capex parsed as “cost inflation” not “investment return”
- AMZN initially −3% AH on capex/FCF concerns; 4/30 next-day open $258 → intraday $266, reclaiming the $263 prior close — the market chose AWS reacceleration over FCF anxiety
- META down despite full beat and 33% revenue growth — fastest since 2021
Implication: The market is now using a microscope to inspect each company’s “capex → revenue” conversion path. Same dollars, but whether the story is told clearly determines stock direction.
Per-Company Breakdown: The “One Signal That Matters”
🟢 GOOGL — Q1 2026: $109.9B Revenue, $460B Cloud Backlog Is the Hardest Data on the Field
Headline numbers:
| Metric | Q1 2026 | YoY |
|---|---|---|
| Revenue | $109.9B | +22% (constant FX +19%) |
| Operating income | $39.7B | +30% |
| Operating margin | 36.1% | +2.3pp |
| Net income | $62.57B | +81% (incl. equity-stake mark-to-market) |
| EPS | $5.11 | +81% |
| Google Cloud | $20.02B | +63% (consensus $18.05B) |
| Google Services | $89.6B | +16% |
| Search | $60.4B | +19% |
| YouTube ads | ~$10B | +11% |
| Paid subscriptions | 350M | — |
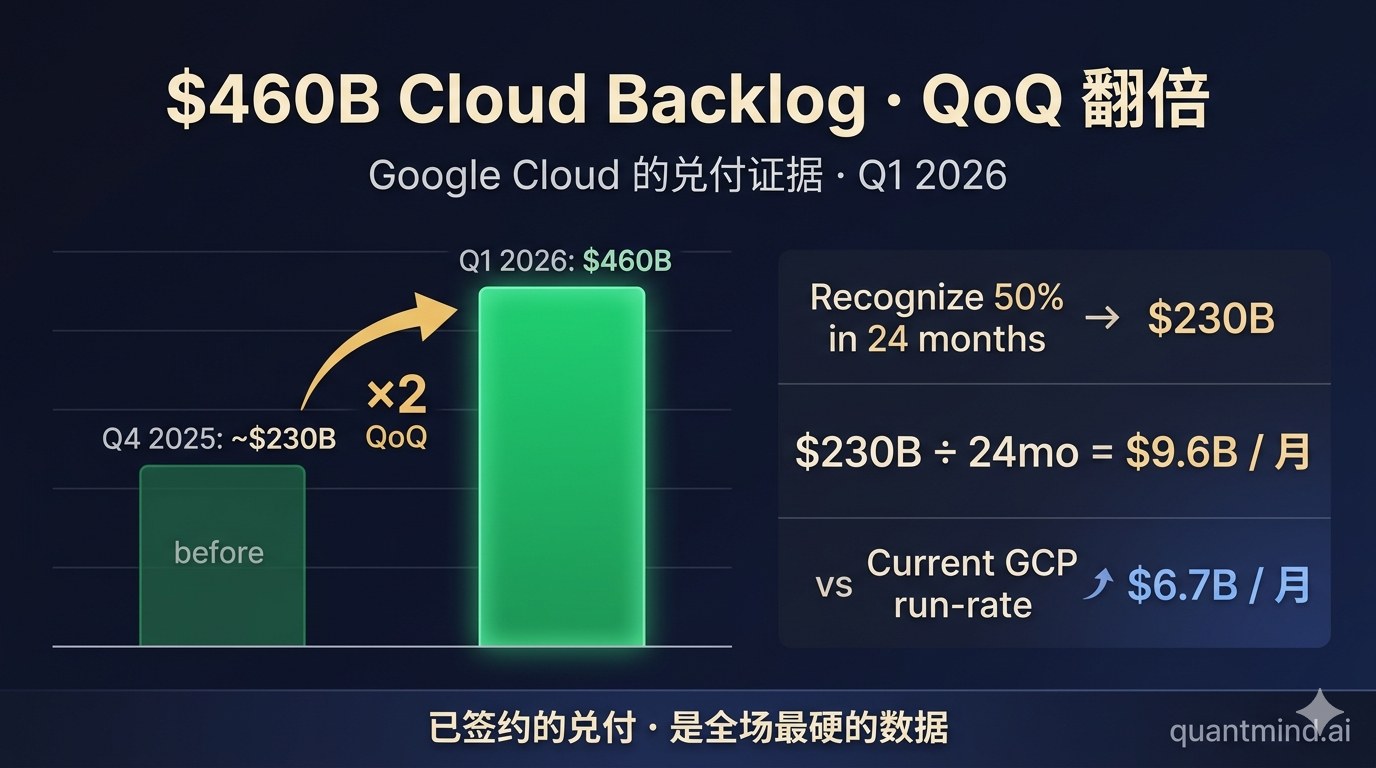
The one signal: Google Cloud’s RPO backlog doubled QoQ from ~$230B to $460B. CFO Anat Ashkenazi explicitly said: “We expect to recognize just over 50% of the backlog as revenue over the next 24 months.”
That math: $230B / 24 months = $9.6B/month of contracted revenue flow, vs current GCP run-rate of ~$6.7B/month.
Translation: Google isn’t selling a story. The $460B is signed contracts (Remaining Performance Obligations) — customers have already committed to pay. This is the only “capex already booked against revenue” hard evidence on the entire field.
Valuation snapshot: - Current price (AH): ~$367 - Forward P/E: ~22x - Probability-weighted 12M target: $405-420 - Implied IRR: ~13-15% → marginally clears 15% hurdle - Action Price: $330 (15% safety margin, first tranche), $310 (25% safety, add)
Bias caveat: A meaningful portion of the +81% net income is equity investment mark-to-market (non-operating). Anchor on the +30% operating income line as the trend.
🟡 MSFT — Q3 FY2026: Azure +40%, But Capacity Capped by GPU Supply
Headline numbers:
| Metric | Q3 FY2026 | YoY |
|---|---|---|
| Revenue | $82.9B | +18% (constant FX +15%) |
| Operating income | $38.4B | +20% |
| EPS | $4.27 | +23% |
| Azure & cloud | — | +40% (consensus +39%) |
| AI business | — | +123% YoY |
| Q3 Capex | $3.4B below estimates | — |
| FY26 Capex | ~$190B (vs $154.6B consensus) | sharply raised |
The one signal: CFO Amy Hood’s quote — “If we’d allocated all newly commissioned GPU capacity to Azure cloud, Azure could have grown above 40%. But we split it across Copilot, GitHub Copilot, and internal workloads.”
Three implications:
- Azure is supply-bound, not demand-bound — GPUs are the bottleneck, with backlogged orders.
- A material chunk of the $35B+ capex raise is passive memory inflation (the company explicitly cited a $25B impact from higher HBM prices) — passive cost shock, not active strategy step-up.
- OpenAI deal restructure (April 27): MSFT no longer pays revshare to OpenAI; OpenAI continues paying MSFT until 2030 (capped) — this is a hidden long-term margin tailwind.
Valuation snapshot: - Current price: ~$475-485 (AH slight dip) - Forward P/E: ~33x - Probability-weighted 12M target: $510-540 - Implied IRR: ~8-12% → fails 15% threshold - Action Price: $420 (first tranche), $390 (add)
Variant View: The market is reading “capex up” as margin pressure, but a real share is passive HBM cost inflation. Once the memory cycle rolls over, that pressure releases. Combined with the OpenAI revshare relief, the 2027-2028 margin expansion window is opening — but it’ll take 2-3 quarters to show in numbers. Not cheap today; wait for the pullback.
🟠 AMZN — Q1 2026: AWS Reaccelerates to 15-Quarter High, But TTM FCF Collapses
Headline numbers:
| Metric | Q1 2026 | YoY |
|---|---|---|
| Revenue | $181.52B | +17% (consensus $177.30B) |
| EPS | $2.78 | huge beat vs $1.64 consensus |
| Net income | $30.26B | — |
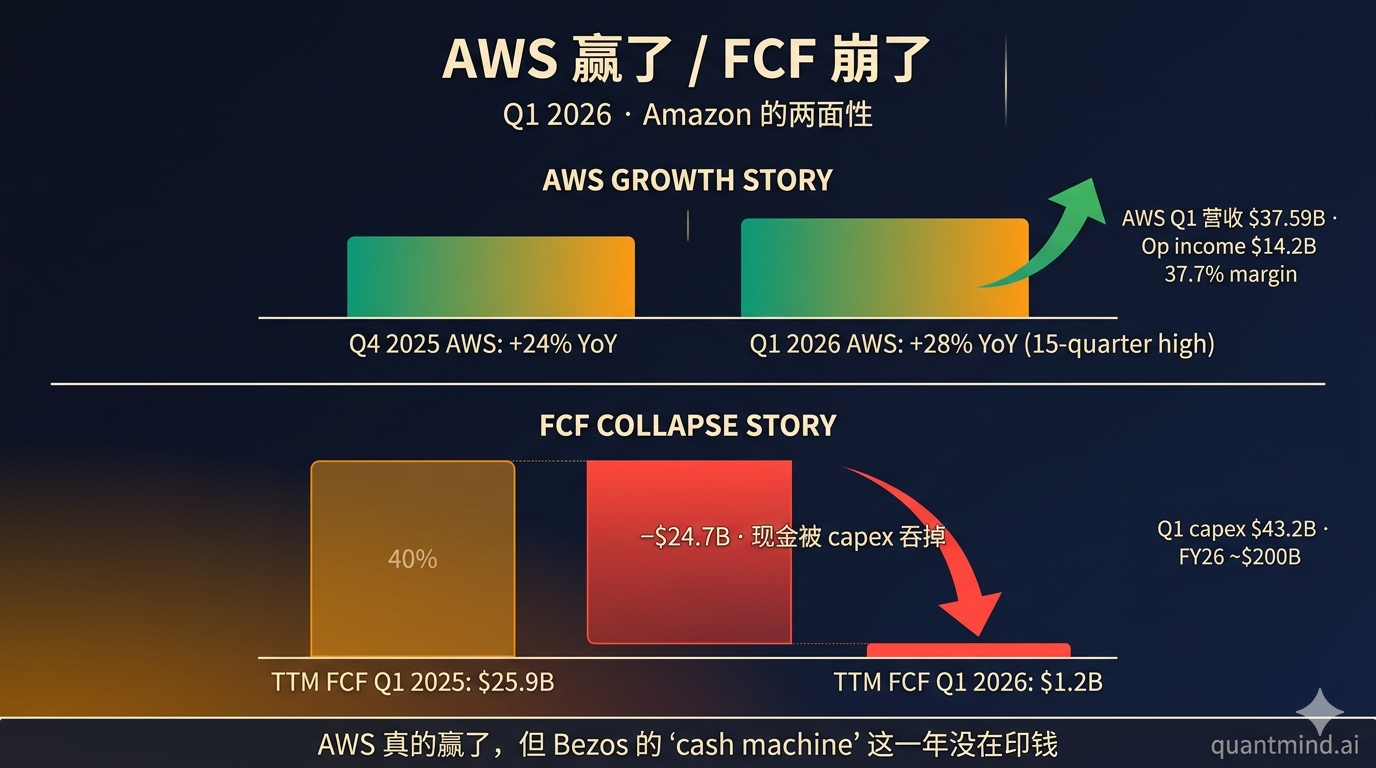
| AWS revenue | $37.59B | +28% (15-quarter high) |
| AWS operating income | $14.2B | 37.7% margin |
| Advertising | $17.24B | +24% (vs +21.2% expected) |
| Q1 Capex | $43.2B | FY guide ~$200B |
| TTM FCF | $1.2B | (down from $25.9B) |
| Q2 revenue guide | $194-199B | — |
| Q2 op income guide | $20-24B | — |
The one signal: AWS growth went from +24% last quarter to +28% — the fastest in 15 quarters, since 2022. Just look at this line and AWS has “redefined itself.” But trailing 12-month FCF collapsed from $25.9B to $1.2B — practically zero.
A brutal trade-off:
“AWS really won. But the ‘cash machine’ Bezos was so proud of did not print cash this year.”
How to read it: AMZN is betting — burning 2 years of FCF for AWS market share in the AI inference era. If AWS growth holds above +25%, FCF rebounds non-linearly in 2027-2028 (capex intensity drops, high-margin AWS revenue keeps compounding). But if AWS slows back below +20% in 2026H2, the FCF vacuum becomes permanent.
Valuation snapshot: - Current price: ~$265 (near recent high) - Forward P/E: ~35x - Probability-weighted 12M target: $280-310 - Implied IRR: ~8-15% → marginal - Action Price: $235 (first tranche), $210 (add)
🔴 META — Q1 2026: 33% Revenue Growth + 41% Operating Margin, Yet Market Sold It Off
Headline numbers:
| Metric | Q1 2026 | YoY |
|---|---|---|
| Revenue | $56.31B | +33% (fastest since 2021) |
| Operating margin | 41% | — |
| EPS (adj) | $7.31 | consensus $6.78 |
| EPS (GAAP) | $10.44 | one-time tax benefit |
| Family of Apps ad revenue | $55.0B | +33% |
| Ad impressions | +19% | — |
| Avg price/ad | +12% | — |
| DAUs | 3.56B | +4% YoY |
| Q1 Capex actual | $19.84B | well below $27.57B consensus |
| FY26 Capex guide | $125-145B | raised (from $115-135B) |
| Capex/Revenue ratio | ~60% | — |
The one signal: Capex/Revenue approaching 60% — and META still has not disclosed an “AI Revenue” line item.
Compare: - GOOGL: spending capex but $460B backlog backstops it - MSFT: spending capex but Azure +40% directly reflects it - AMZN: spending capex but AWS +28% rebound validates it - META: build-the-building-then-find-tenants mode
The +33% ad growth is genuinely strong, but it reflects ad market recovery + Reels/Threads monetization — the causal link to AI capex is indirect. AI capex is supposed to pay off through “agentic AI,” “AI for advertisers,” “AI-generated content” — none of which have separate revenue disclosure today.
Another uncomfortable signal: Q1 actual capex was $19.84B — far below the $27.57B Wall Street estimated. Yet FY guidance was raised to $125-145B. That implies $105-125B across the back three quarters — sharp acceleration. Markets are asking: can the money even be spent? Or is execution risk ahead?
Variety also reported the CEO is planning more layoffs. With revenue +33% and margins at 41%, more layoffs to free up budget for AI infrastructure — bullish (focus) and bearish (talent war risk) at the same time.
Valuation snapshot: - Current price: ~$605-620 (AH down to $590s) - Forward P/E: ~25x - Probability-weighted 12M target: $580-650 - Implied IRR: ~−5% to +8% → fails the threshold - Action Price: $510 (first tranche), $470 (add)
Comparative: Whose “Capex → Revenue” Path Is Clearest?
| Dimension | GOOGL 🥇 | MSFT 🥈 | AMZN 🥉 | META |
|---|---|---|---|---|
| Capex/Revenue | 40% | 50% | 25% | 60% |
| Signed backlog | $460B (QoQ ×2) | not disclosed | not disclosed | not disclosed |
| Cloud growth | +63% | +40% (capacity-capped) | +28% (15Q high) | n/a |
| Regulatory/antitrust risk | High (DOJ case) | Medium | Medium | High (Cambridge Analytica overhang) |
| One-time accounting | Equity investments | None material | None material | Tax benefit |
| Market reaction (AH + 4/30 intraday) | +6% (new ATH ~$367) | Slight dip | Initial −3% → next-day $266 rebid | Down (not yet repaired) |
| My verdict | Long core | Long, wait | Long-observe (rebid) | PASS |
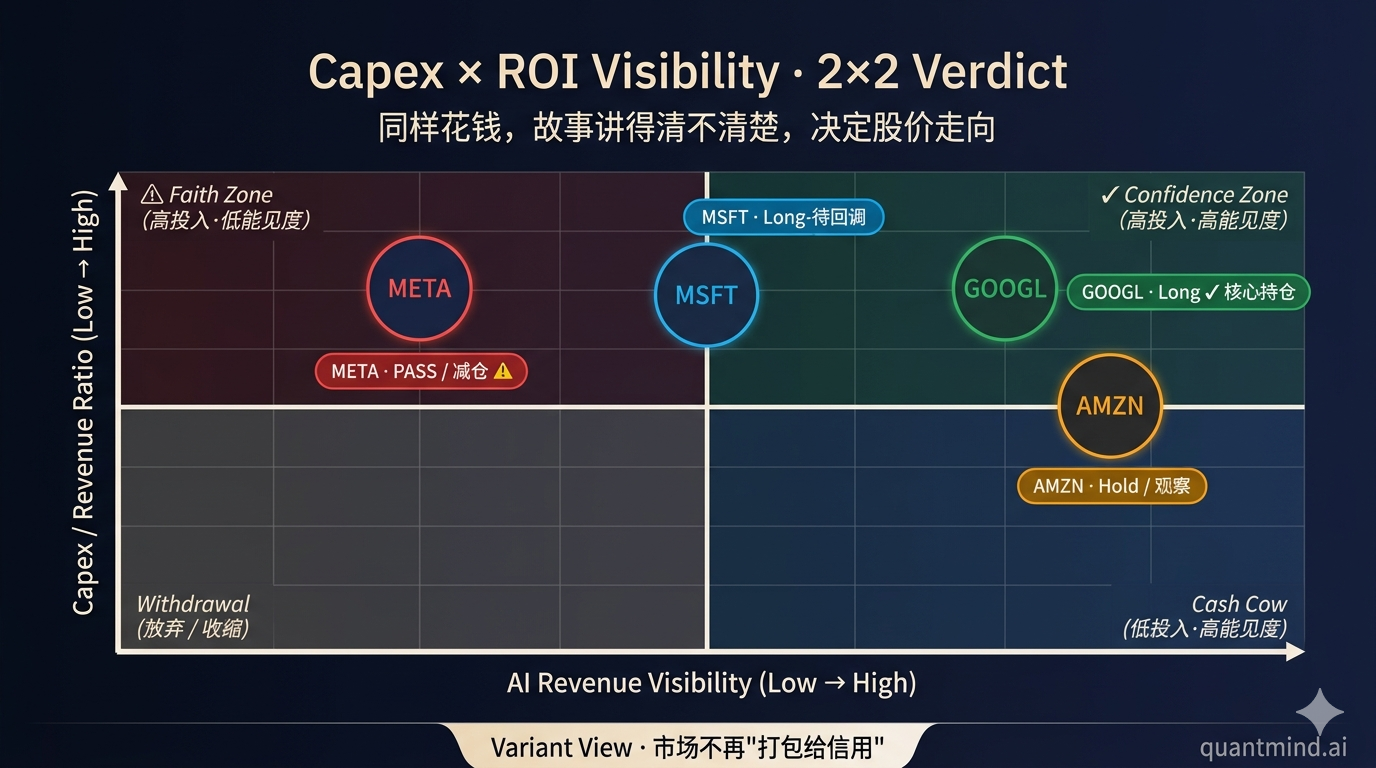
Variant View
Market consensus: All four are AI beneficiaries; capex raises are bullish — rising tide lifts all boats.
My view: The “AI infrastructure ETF” mental model that worked for 24 months started failing tonight. The market is entering a “ROI-by-name” phase. Same capex, but:
- Backlog-backed (GOOGL) = value investment
- Capacity-bound evidence (MSFT) = growth investment
- Cloud-acceleration evidence (AMZN) but FCF overdrawn = cyclical bet
- No clear revenue path (META) = faith investment
Why the market was wrong before: In 2024-2025 every capex dollar was reflexively translated into “AI revenue.” But total capex has gotten too large ($700B/year now) — the market has to start being picky. Which capex has contractual backstop, which is speculative build? This unbundling will run 2-4 quarters; GOOGL’s relative alpha persists, META’s relative beta persists.
Falsification point: If META in Q2 or Q3 publishes a separate “AI Revenue” disclosure that exceeds $5B/quarter, my call flips immediately. That’s the single most important watch item.
6 Investing Lenses
| Lens | GOOGL | MSFT | AMZN | META |
|---|---|---|---|---|
| 🏦 Quality Compounders (Buffett) | Long | Long | PASS (FCF vacuum) | PASS |
| 🚀 Imagination Growth (ARK) | Long | Long | Long | Long |
| 📈 Long/Short Fundamental (Tiger) | Long | Wait | Observe | Short candidate |
| 💎 Deep Value (Klarman) | Marginal | PASS (rich) | Marginal | PASS |
| ⚡ Catalyst (Ackman/Tepper) | Long (backlog disclosed) | Wait for OpenAI impact | Wait for FCF rebound | PASS |
| 🌍 Macro Tactical (Druckenmiller) | Long | Neutral | Neutral | Neutral |
Pre-Mortem: If This Article Is Badly Wrong in 2 Years, What Killed It?
Path A (35%): META suddenly publishes a separate “AI Revenue” line in Q2 or Q3 with strong numbers → my “faith investment” framing falsified → META’s multiple expands and outruns GOOGL.
Path B (25%): GOOGL’s $460B backlog actually recognizes less than 50% over 24 months (customer breach / contract renegotiation) → the only hard data point fails → AI infrastructure narrative cracks.
Path C (20%): HBM memory pricing unexpectedly rolls over → MSFT/AMZN capex intensity drops sharply → FCF rebounds faster than expected → those two re-rate higher and beat GOOGL.
Path D (15%): Regulatory shock (DOJ antitrust, EU AI Act) hits GOOGL Search/ads materially → cloud strength can’t offset.
Path E (5%): Macro systemic risk (recession, geopolitical conflict) → entire AI capex cycle interrupted → all four sell off.
Action Triggers (Quantifiable Conditions)
| Signal | Action | Ticker | Size |
|---|---|---|---|
| GOOGL pulls back to $330 | First tranche | GOOGL | 25% |
| GOOGL pulls back to $310 | Add | GOOGL | +20% |
| MSFT pulls back to $420 | First tranche | MSFT | 20% |
| AMZN pulls back to $235 + AWS growth ≥ +25% | First tranche | AMZN | 15% |
| META discloses standalone AI revenue > $5B/quarter | Flip thesis, build | META | 20% |
| META raises capex again without AI revenue disclosure | Trim / avoid | META | — |
| Any name shows cloud growth QoQ −5pp | Trim that name | individual | −30% |
| Surprise Fed hike / HBM prices keep rising | Trim full book | all | −20% |
Long-Term Watch Variables
Over the next four quarters, these data points decide whether I was wrong:
- GOOGL Cloud Backlog: Can it keep growing QoQ? If a quarter goes flat or declines — alarm.
- META “AI Revenue” disclosure: The biggest falsification point.
- AMZN TTM FCF rebound timing: If still under $50B by end of 2026, the bet failed.
- MSFT Azure growth: Can it accelerate above +42% in 2026H2? Capacity-unlock evidence.
- HBM memory pricing: Key exogenous variable for all four margins.
- OpenAI–MSFT post-restructure dynamics: Does OpenAI shop for other cloud partners?
- Google Search market share under AI-browser pressure (OpenAI Operator, Anthropic Computer Use): Can Search hold +19% YoY?
Conclusion
Four tech giants reported the same night. The market voted with prices, and gave the first clear differentiation signal: capex with contract backstop gets rewarded; speculative capex gets punished.
Operationally: - GOOGL has the cleanest setup — $460B backlog is the field’s hardest data. AH already +6%; wait for $330 to enter. - MSFT is the second-cleanest — OpenAI deal restructure is an under-priced long-term tailwind, but IRR doesn’t clear hurdle today. Wait for $420. - AMZN got bid back the day after — the AWS-reacceleration story beat the FCF-collapse story; intraday 4/30 reclaimed $266 above the prior close. The 18-24 months of “accounting cripple” is unchanged though — half size, wait for $235 to add. - META is the most dangerous — not cheap (25x forward) + 60% capex/revenue + no AI revenue disclosure. Wait for AI revenue line, or for the stock to break $510.
If you can only own one, own GOOGL. If you can only short one, short META (carefully — short squeeze risk is real).
Closing Thought
What I felt most after reading all four was this: two years ago we said “AI is the picks-and-shovels trade — sell the water.” Now even the water-sellers are stratifying.
GOOGL signed 24-month water-supply contracts before opening the tap — $230B locked in. MSFT is selling water but the pipes are too small; customers queue. AMZN dug the deepest reservoir, but every miner is digging this year and its wallet is empty. META is still digging the cistern, telling you “lots of water coming, we’re working out how to charge for it.”
Four tech companies, four winning postures. The market started looking at each posture under a microscope tonight.
The one-line verdict: AI capex is the bet. Monetization is the payoff. Tonight, only Google showed the receipt.
I’ll watch those 7 monitoring variables across the next four quarters. If META suddenly drops a fat AI-revenue line in Q2, I’ll be the first to flip and go long. The market isn’t black-and-white; every quarter’s earnings re-prices my view.
But tonight, the answer is clear to me.
Analysis based on public data as of April 29, 2026 post-market. GOOGL/MSFT/META reported same-night Q1 results; AMZN data from concurrent same-day release. All valuation assumptions are independent estimates and do not constitute investment advice — research only.
Sources: CNBC, Motley Fool earnings call transcripts (4 companies), Microsoft FY26 Q3 IR, Alphabet Q1 2026 IR, Meta Q1 2026 IR, Amazon Q1 2026 IR, Yahoo Finance, Bloomberg, Investing.com.
⚠️ Disclaimer: This analysis combines public data with independent estimates. Not investment advice. Markets carry risk; do your own work.