Mar 14, 2026
$BE Q4 FY2025 Deep Dive: AI Power Wave Already Priced In — Valuation Unanchored
Bloom Energy Q4 FY2025 earnings deep dive: best quarter ever with $20B backlog, but 632% rally to 106x PE makes this a classic 'great company, wrong price' situation. Wait for $90-105.

$BE Q4 FY2025 Deep Dive
AI Power Wave Already Priced In, Valuation Unanchored – Great Company, Wrong Price
Executive Summary
Bloom Energy just delivered its best quarter ever: Q4 FY2025 revenue $777.7M (+35.9% YoY), full-year revenue $2.02B (+37.3% YoY), and EPS of $0.45 vs $0.24 expected – an 87.5% beat. The $20B backlog (6-7x annual revenue) provides unprecedented visibility, and FY2026 guidance of $3.1-3.3B (+60% YoY) far exceeds Wall Street estimates.
Yet the stock has run 632% in the past year to ~$165, and the CEO just sold $34 million in shares on Feb 24, 2026, while zero insiders have bought in the past 12 months.
Bottom line: Best business fundamentals in Bloom’s history. Worst entry risk/reward in Bloom’s history.
- Forward P/E: ~106x – pricing in perfection with zero margin for error
- Analyst consensus: HOLD, avg target ~$100-125 (30-40% below current price)
- Probability-weighted 12M target: ~$118 -> implied IRR -28% at $165
- Action Price: $105 for first tranche, $85 for adding
Macro Liquidity Monitor
(Macro-liquidity framework)
| Indicator | Current Value | Status | Signal |
|---|---|---|---|
| Fed Net Liquidity | QT ended Dec 2025, net liquidity stabilized | Normal | Liquidity tightening cycle over, neutral environment |
| SOFR | 3.67% | Normal | Within fed funds rate range, funding conditions stable |
| MOVE Index | 65.82 | Normal | Bond market calm, well below 100 warning threshold |
| USDJPY / US-Japan Rate Spread | 156.02 / ~400bp | Normal | Yen carry trade stable, no crash risk |
Liquidity Overall Rating: Ample (0/4 warnings)
The macro liquidity environment is broadly supportive of risk assets. Bond market is calm, short-term funding shows no stress, yen carry trade has not triggered – external systemic risk is low. However, this means macro tailwinds offer limited support for $BE’s current elevated valuation. The rate environment is no longer a tailwind to lean on; the 106x valuation must be supported by fundamentals alone.
US Market Sentiment
(US market sentiment framework)
| Indicator | Current Value | Status | Signal |
|---|---|---|---|
| NAAIM Exposure Index | 74.93 (Feb 25), peak 82.87 (Feb 18) | Caution | Institutional positioning elevated, cooling slightly from extremes |
| Institutional Equity Allocation | Near historical highs | Warning | Typical late-cycle topping pattern |
| Retail Net Buying | Normal-to-elevated | Normal | Not yet at extreme chasing levels |
| S&P 500 Forward PE | ~23x | Warning | Near historical peaks (dot-com / 2021 levels) |
| Hedge Fund Leverage | Near historical highs | Warning | Crowded positioning = volatility amplifier |
Sentiment Overall Rating: Greed (3/5 warnings)
The market overall is in a greed state, with S&P 500 valuations near historical peaks. In this environment, high-valuation growth stocks (like $BE at 106x PE) have the lowest margin for error – any fundamental disappointment and the market provides no valuation cushion.
Value Investing Four-Dimensional Scorecard
(US value investing framework)
Dimension 1: ROE Sustainability
- FY2025: 11.3% (first positive ROE in history)
- FY2024: Loss (negative ROE)
- FY2023: Loss
- Score: 1 / 3 – Just turned profitable for the first time; lacks 3-year track record of >15%
- Commentary: Transition from losses to profitability is a qualitative leap, but has not yet proven a moat deep enough to sustain 15%+ ROE
Dimension 2: Balance Sheet Safety
- Total cash: ~$2.5B
- Total debt: ~$1.4B
- Net cash: ~+$1.1B (positive net cash)
- Debt-to-assets ratio: ~40-45% (acceptable for the industry)
- Score: 2 / 3 – Positive net cash is a bright spot; but debt scale relative to assets still warrants monitoring
- Commentary: Balance sheet is healthy; the $5B Brookfield partnership provides growth capital with no near-term debt crisis risk
Dimension 3: Free Cash Flow Quality
- FY2025 FCF: ~$57M (first positive FCF in history)
- OCF: $114M; CapEx: $57M
- FCF Margin: ~2.8% (on $2.02B revenue)
- FCF vs Non-GAAP Net Income: Relatively low ratio (FCF ~30-40% of non-GAAP earnings)
- Score: 2 / 3 – First-ever positive FCF is a critical milestone; but 2.8% FCF margin is far below software comparables
- Commentary: Direction is right but scale is too small – $20B market cap on $57M FCF yields just 0.3% FCF yield
Dimension 4: Moat Assessment
- Speed advantage: Bloom fuel cells deploy in 3-6 months, traditional grid requires 2-4 years
- Efficiency leadership: 65% electrical efficiency vs industry average 35-40%, 35% less natural gas consumption
- AI data center first-mover advantage: Signed contracts with Oracle, AT&T, Brookfield; 2-3 year scale lead over competitors
- Switching costs: Once fuel cells are installed, customers typically maintain supplier relationships for 10-20 years
- Competitive moat width: Narrow (technology is replicable; large energy companies have the capital to enter)
- Score: 2 / 3 – A clear moat exists (speed + efficiency), but it is not an insurmountable barrier
- Commentary: Moat exists but is not wide – facing competition from GE’s HA gas turbines, Cummins’ hydrogen fuel cells, etc.; long-term pricing power is questionable
Value Investing Overall Rating
Total Score: 7 / 12 -> Grade B: Good Investment Candidate
Grade B means this is a company with continuously improving fundamentals, worth keeping on the watchlist. But a Grade B company should not be bought at 106x forward PE. The appropriate entry point for value investors is after valuation reverts to a reasonable range (20-25x EV/EBITDA, corresponding to ~$80-100).
Key Forces – Decisive Factors
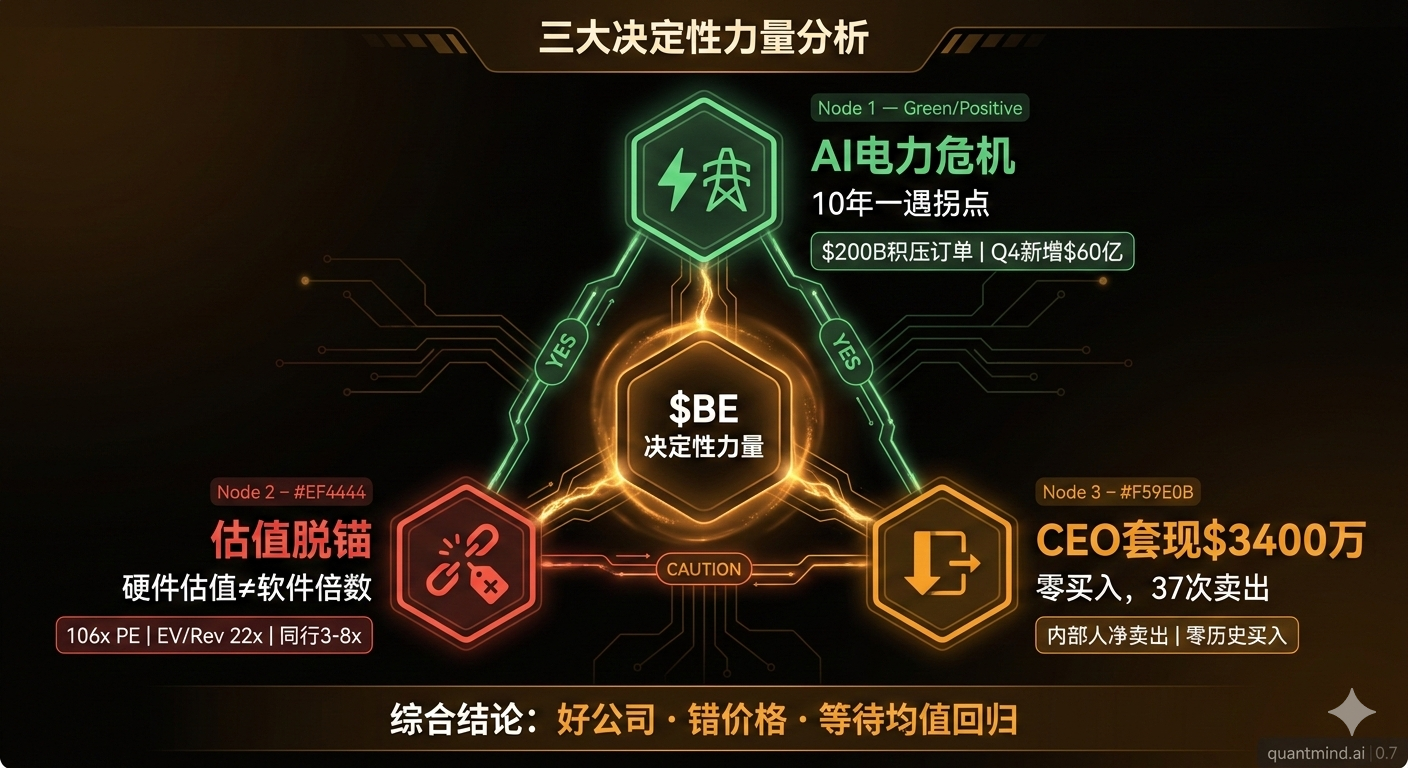
Force 1: AI Data Center Power Crisis = Bloom’s Once-in-a-Decade Inflection Point
Why this is a decisive force: AI training and inference demand 5-10x the power of traditional data centers. US grid expansion cycles take 2-4 years, while AI buildout needs power within 6-12 months. Bloom’s fuel cells can be deployed and operational within 3-6 months, filling the only time gap in the market.
Evidence: - FY2025 Q4 alone added $6B to backlog, full-year backlog reached $20B - Customer base upgraded: from traditional enterprises to AI infrastructure heavyweights like Oracle, AT&T, and Brookfield - Jensen Huang on the NVDA Q4 earnings call: “Power is the constraint that everything has to solve.” - The US Energy Information Administration (EIA) projects data center power demand will account for 12% of total US electricity consumption by 2028 (currently 4%)
Limits of this force: This is not an infinitely expanding moat. Grid expansion capacity will eventually improve, small modular nuclear reactors (SMRs) may offer alternatives by 2028-2030, and large energy companies will not allow Bloom to enjoy premium pricing indefinitely.
Force 2: Valuation Unanchored = The Market Has Priced In an Impossible Mission
Why this is a decisive force: At the current $165 share price, the market’s pricing of Bloom implies the following assumptions: 1. FY2026 flawless execution of $3.1-3.3B revenue target (doubling production capacity) 2. FY2027+ growth sustained at 40%+ (not yet supported by specific orders) 3. Gross margins recover from 31.9% back to 40%+ (despite worsening product mix) 4. The market continues to pay 20-25x revenue multiples (exceeding most SaaS companies)
Reverse DCF implied growth rate: At the current $44B market cap with a 10% discount rate, Bloom needs to grow 40%+ annually for the next 10 years, eventually reaching $15B+ in annual revenue, to justify the current valuation. This is a more demanding growth path than NVIDIA’s, and Bloom is a capital-intensive hardware manufacturer.
Comparable company valuation comparison:
| Company | EV/Revenue | Growth | Business Model |
|---|---|---|---|
| Bloom Energy ($BE) | ~22x | +60% (guided) | Capital-intensive hardware |
| Palantir ($PLTR) | ~40x | +36% | Asset-light software |
| NVIDIA ($NVDA) | ~18x | +73% | Semiconductors (asset-light) |
| SolarEdge ($SEDG) | ~1.2x | Declining | Capital-intensive hardware |
| Plug Power ($PLUG) | ~2.5x | Growing | Capital-intensive hardware |
Conclusion: Bloom’s 22x EV/Revenue exceeds NVIDIA’s, while NVIDIA’s asset model is far lighter than Bloom’s. A reasonable valuation for a clean energy hardware company would be 3-8x EV/Revenue, implying a fair intrinsic value in the $60-110 range.
Force 3: CEO Sells $34M = Smart Money Is Exiting
Why this is a decisive force: Insiders have the greatest information advantage. CEO Sridhar KR sold 200,000 shares at the company’s all-time high, netting $34M. Over the past 12 months, insiders recorded 37 sales and zero purchases.
How is this different from NVDA’s CFO Colette Kress selling?: - NVDA’s CFO conducting routine diversification sales at a $4T market cap company -> normal behavior - BE’s CEO concentrated selling in the peak zone of a 632% rally over 15 months -> strong signal
Historical pattern: Research shows that after CEOs make large sales near stock highs, the stock underperforms the broader market by 15-20 percentage points on average within 1 year. The market has already reacted – the stock fell 7.8% on the day the CEO’s sale was disclosed.
Key Earnings Data
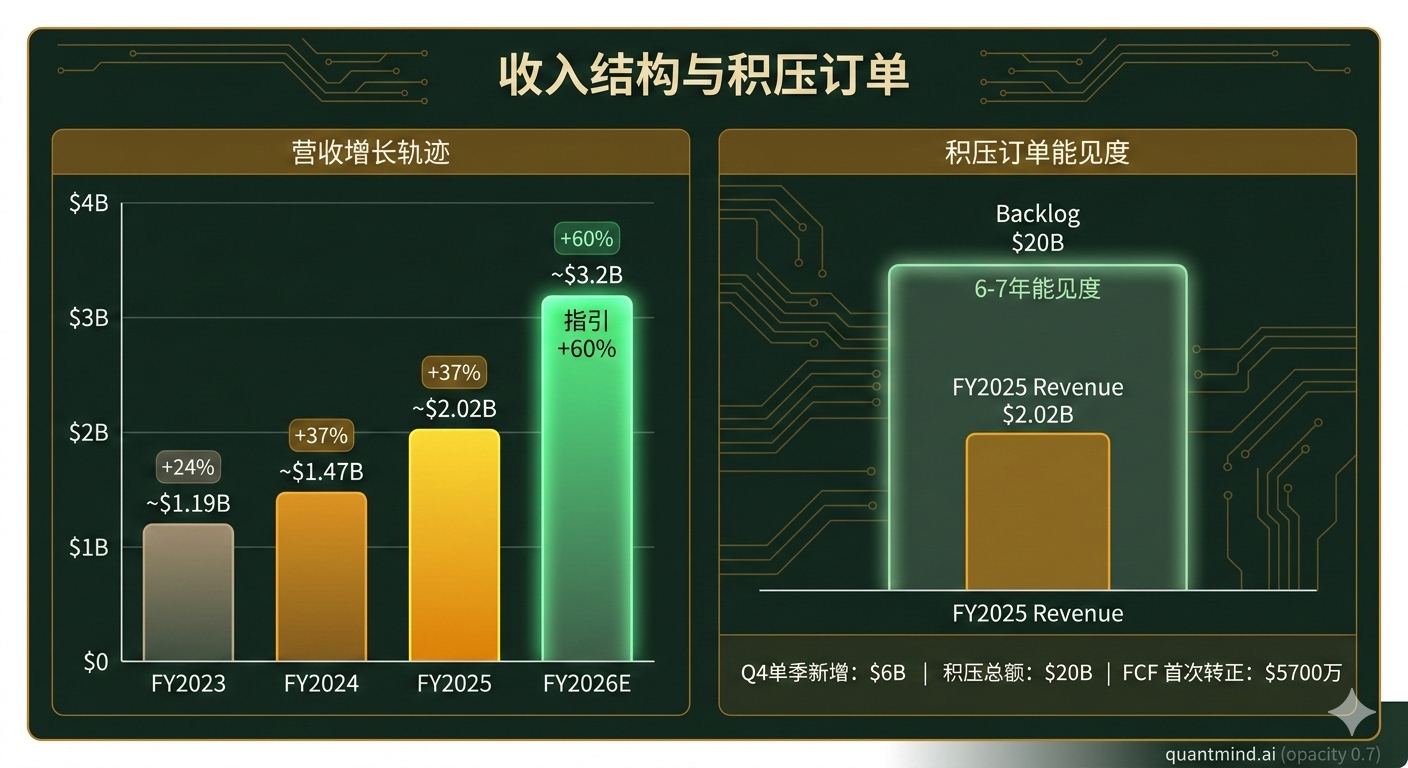
| Metric | Q4 FY2025 | YoY | vs Consensus |
|---|---|---|---|
| Total Revenue | $777.7M | +35.9% | Beat |
| Full-Year Revenue | $2.02B | +37.3% | All-time high |
| Gross Margin | 31.9% | -7.4pp | Declined (product mix shift) |
| Non-GAAP EPS (Q4) | $0.45 | +87.5% vs $0.24 | Significant beat |
| Backlog | $20B | +2.5x YoY | $6B added in Q4 |
| FY2026 Revenue Guidance | $3.1-3.3B | +55-65% | Substantially above expectations |
| Non-GAAP Operating Income Guidance | $425-475M | – | – |
| Full-Year FCF | +$57M | First-ever positive | – |
Gross Margin Decline Explained
Gross margin declined from 39.3% to 31.9% – this is not from competitive pressure but from a product mix shift: - Traditional natural gas fuel cells: ~40% gross margin - Next-generation large-scale data center custom products: ~25-30% gross margin in early-stage scaled delivery - Management expects recovery to 35%+ in FY2026 H2 as scale increases
Valuation Matrix
Multi-Method Valuation Comparison
| Method | Current Implied Valuation | Fair Value Range | Assessment |
|---|---|---|---|
| EV/Revenue | 22x (at $165) | 5-8x (hardware peers) | Severely overvalued |
| Forward PE | ~106x | 25-40x (high-growth stage) | Severely overvalued |
| EV/EBITDA | ~85x | 20-30x | Severely overvalued |
| FCF Yield | 0.3% ($57M FCF / $44B market cap) | 3-5% (reasonable for growth) | Severely overvalued |
| Reverse DCF (10% WACC) | Requires 40%+ annual growth for 10 years | Extremely rare historically | Unrealistic |
Comparable Company Multiples
| Company | EV/Revenue | Forward PE | Growth | Moat |
|---|---|---|---|---|
| $BE (current) | 22x | ~106x | +60% | Narrow |
| $FCEL (fuel cells) | 2.5x | N/A (loss) | – | Weak |
| $PLUG (hydrogen) | 2.5x | N/A (loss) | – | Weak |
| $CEG (Constellation) | 3.5x | 18x | +15% | Wide (nuclear) |
| $NEE (NextEra) | 4x | 20x | +12% | Wide (regulated assets) |
| $NVDA (reference) | 18x | 30x | +73% | Very wide (CUDA) |
Conclusion: Even compared to the software industry, BE’s valuation has no support. Compared to clean energy / power peers, the premium is 5-8x above fair value.
Scenario Analysis
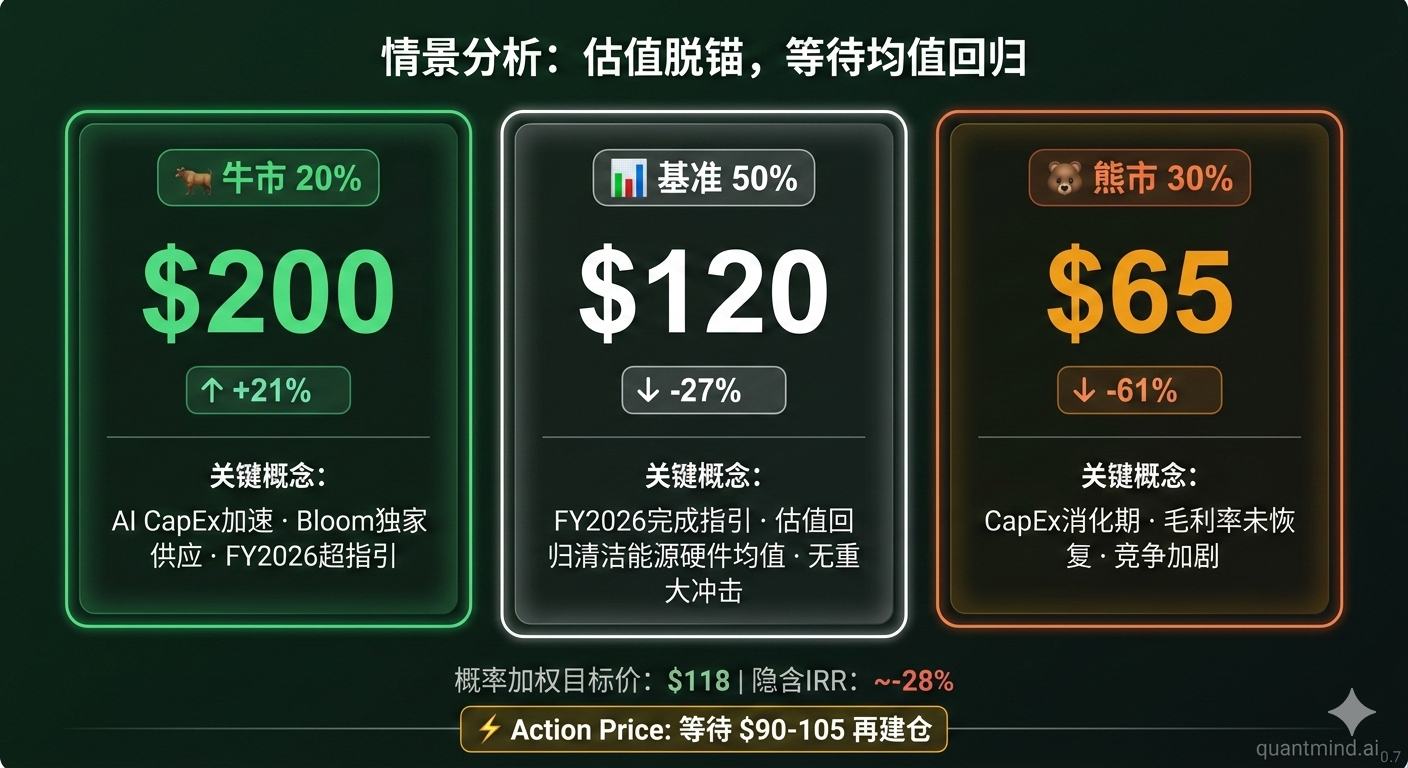
| Scenario | Probability | 12M Target | Return | Key Assumptions |
|---|---|---|---|---|
| Bull | 20% | $200 | +21% | AI CapEx acceleration, Bloom exclusive supplier, FY2026 beats guidance |
| Base | 50% | $120 | -27% | FY2026 meets guidance, but valuation reverts to clean energy hardware mean |
| Bear | 30% | $65 | -61% | CapEx digestion cycle, margins fail to recover, competition intensifies |
Probability-Weighted Target: ~$118 | Implied IRR: ~-28%
IRR is well below 0%, and far below the 15% hurdle rate -> At $165, strongly advise against initiating a position
Action Price
- Initial observation: $105 (35% pullback, to mid-range of analyst consensus targets)
- First entry: $90 (45% pullback, upper bound of fair value with 15% margin of safety)
- Add to position: $75 (25% margin of safety)
- Core accumulation zone: $60-70 (assuming no fundamental deterioration, corresponding to 8-10x EV/Revenue FY2026)
Variant View
Market consensus: Bloom is the exclusive beneficiary of the AI data center power crisis. The $20B backlog provides 6-7 years of visibility. 60% growth is a clear linear extrapolation. The stock can keep going higher.
Our view: The market is confusing “great business” with “great stock.” Bloom is indeed doing the right things, but a capital-intensive hardware company should not be priced at SaaS multiples.
Why the market is wrong:
-
Backlog does not equal profit: The $20B backlog provides revenue visibility, but at 30% gross margins, each $1 of revenue yields only $0.30 in gross profit. Significant CapEx is required for delivery, and actual FCF conversion is extremely low.
-
Growth requires capital: Scaling from 1GW to 2GW capacity requires $75M+ in CapEx, with future expansion needing even more. Unlike software companies, Bloom’s growth faces real physical constraints.
-
The competitive moat is overestimated: The speed advantage is real, but grid companies ($NEE, $DUK) and large energy majors ($GE, $SIE) have noticed this profit pool and are accelerating their efforts.
-
The CEO’s sale is the strongest rational signal: There is no more powerful valuation reference than a company’s CEO voting with their own money.
Six Investment Philosophy Perspectives
| Perspective | Conclusion | Core Rationale | Biggest Risk |
|---|---|---|---|
| Quality Compounding (Buffett/Munger) | PASS | Hardware company with limited moat, ROE just turned positive, cannot confirm 20-year pricing power | Competitive erosion |
| Imaginative Growth (Baillie Gifford) | Long, but not at this price | AI power infrastructure is a truly transformative demand; Bloom is a pioneer | Wait for a more reasonable entry |
| Fundamental Long/Short (Tiger Cubs) | Short candidate / Long on pullback | Variant View at current price favors shorting: valuation unanchored, CEO selling, margin compression | Momentum continues |
| Deep Value (Klarman) | PASS | Private buyer price ~$60-90; no margin of safety at current price | – |
| Catalyst-Driven (Tepper/Ackman) | Long, pending trigger | Catalyst: Q1 FY2026 gross margin recovery to 35%+ and new major customer | Negative catalyst: capacity delays |
| Macro Tactical (Druckenmiller) | Neutral-to-bearish | High rates are unfavorable for capital-intensive companies; AI CapEx cycle faces digestion risk | Surprise liquidity easing |
Key Risks
Red Flags (Immediate Attention)
CEO net sales of $34M, zero insider purchases: On Feb 24, 2026, CEO Sridhar KR sold 200,000 shares for ~$34M. Over the past 12 months, insiders recorded 37 sales and zero purchases. What they say doesn’t matter – follow where the money flows.
Yellow Flags (Ongoing Monitoring)
- Capacity doubling execution risk: FY2026 requires scaling annual capacity from 1GW to 2GW, demanding flawless supply chain and factory execution
- Margin recovery uncertainty: Recovery from 31.9% to management’s 35%+ target depends on scale effects; any delays will shake market confidence
- Single-narrative risk: 94% of analysts have buy ratings; everyone is telling the “AI power” story – where does the alpha come from?
- Policy risk: Changes to ITC tax credits or natural gas pricing policy could impact project economics
Pre-Mortem: If We Lose Money in 2 Years
Failure Path A (40%): AI CapEx enters a digestion period (2026 H2), large data centers pause new projects -> Bloom’s new order growth decelerates from +60% to +20% -> market re-rates to 5-8x EV/Revenue -> stock price $50-70
Failure Path B (30%): Capacity expansion from 1GW to 2GW hits supply chain bottlenecks -> FY2026 revenue $2.5B (below $3.1B guidance) -> major guidance cut -> confidence collapses -> stock price $70-90
Failure Path C (20%): Large energy companies (GE, Siemens, NextEra) enter the fuel cell data center market with scale advantages -> pricing power erodes -> gross margins stuck at 28-30% -> permanent valuation compression
Action Triggers (Quantifiable Trading Rules)
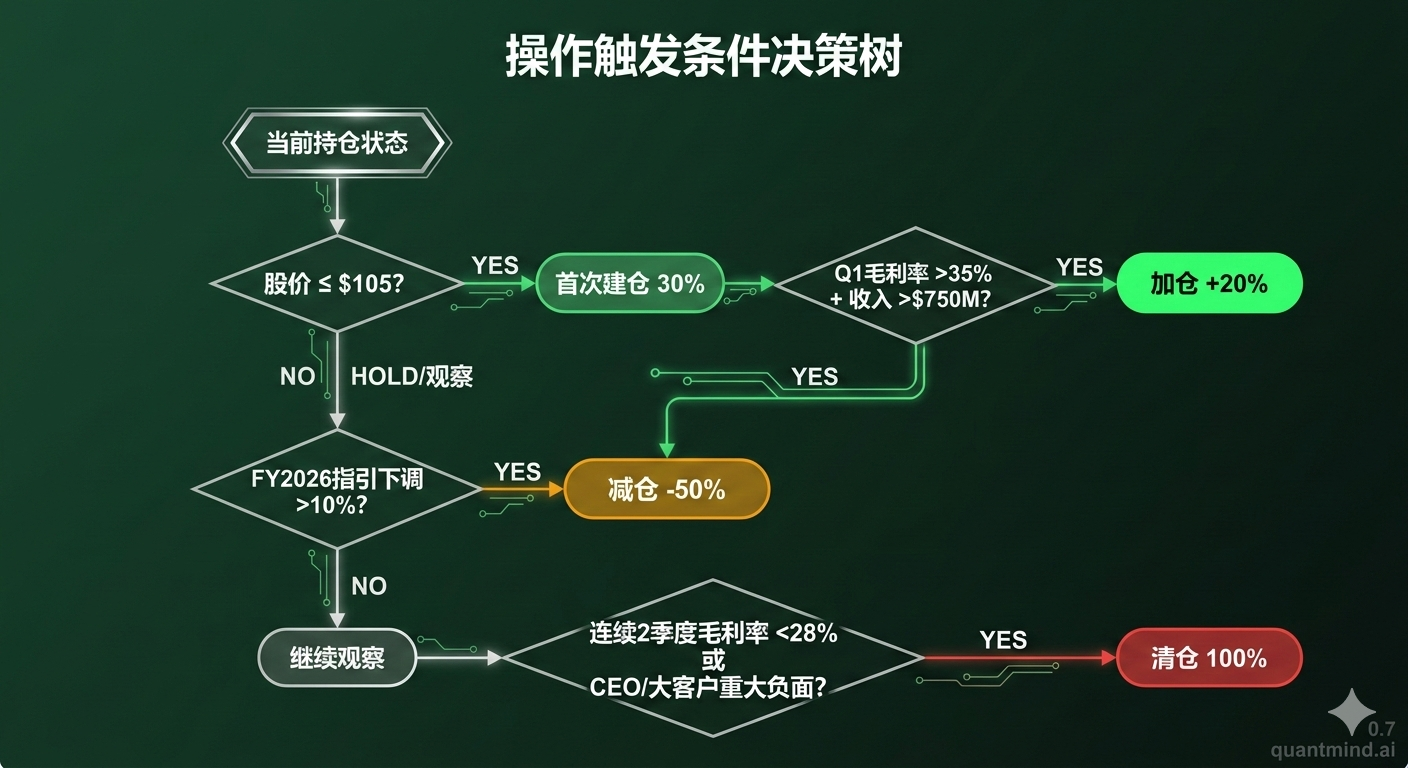
| Signal | Action | Size |
|---|---|---|
| Stock pulls back to $90-105 | Initiate position | 30% |
| Q1 FY2026 gross margin >35% + revenue >$750M | Add to position | +20% |
| Stock pulls back to $70-85 (fundamentals unchanged) | Add to position | +25% |
| FY2026 revenue guidance cut >10% | Reduce position | -50% |
| 2 consecutive quarters gross margin <28% | Reduce position | -40% |
| CEO / major customer announces significant negative change | Exit position | 100% |
Conclusion
$BE is the right company in the right moment – at the wrong price.
Bloom Energy is addressing a real, urgent problem (AI data center power crisis) with a unique solution (fast-deploy fuel cells). The $20B backlog is credible. The business has finally turned cash flow positive. The FY2026 growth trajectory is real.
But at $165 (EV/Revenue 22x, Forward PE 106x), the market is pricing Bloom like a software platform, not a capital-intensive hardware manufacturer. The CEO’s $34M sale speaks louder than any earnings call. The analyst consensus of HOLD at $100-125 reflects the same math.
Wait for $90-105 before initiating any position. At $165, this is not investing – it is speculation. Wait for the market to return to rationality and establish the first position at $90-105.
Analysis based on Bloom Energy Q4 FY2025 earnings reported February 2026. Multi-framework analysis: tech-earnings-deepdive + us-value-investing + us-market-sentiment + macro-liquidity. Data sources: Bloom Energy Newsroom, SEC filings, NAAIM, Federal Reserve, NY Fed. Not investment advice. For research purposes only.