Mar 14, 2026
$AVGO Q1 FY2026 Deep Dive: The Supercompute Monopolist the Market Hasn't Priced In
Broadcom Q1 FY2026 earnings deep dive: exclusive XPU supplier to 5 hyperscale AI labs, $73B locked backlog, 68% EBITDA margins, implied IRR 28%. A comprehensive analysis of the AI infrastructure monopolist.
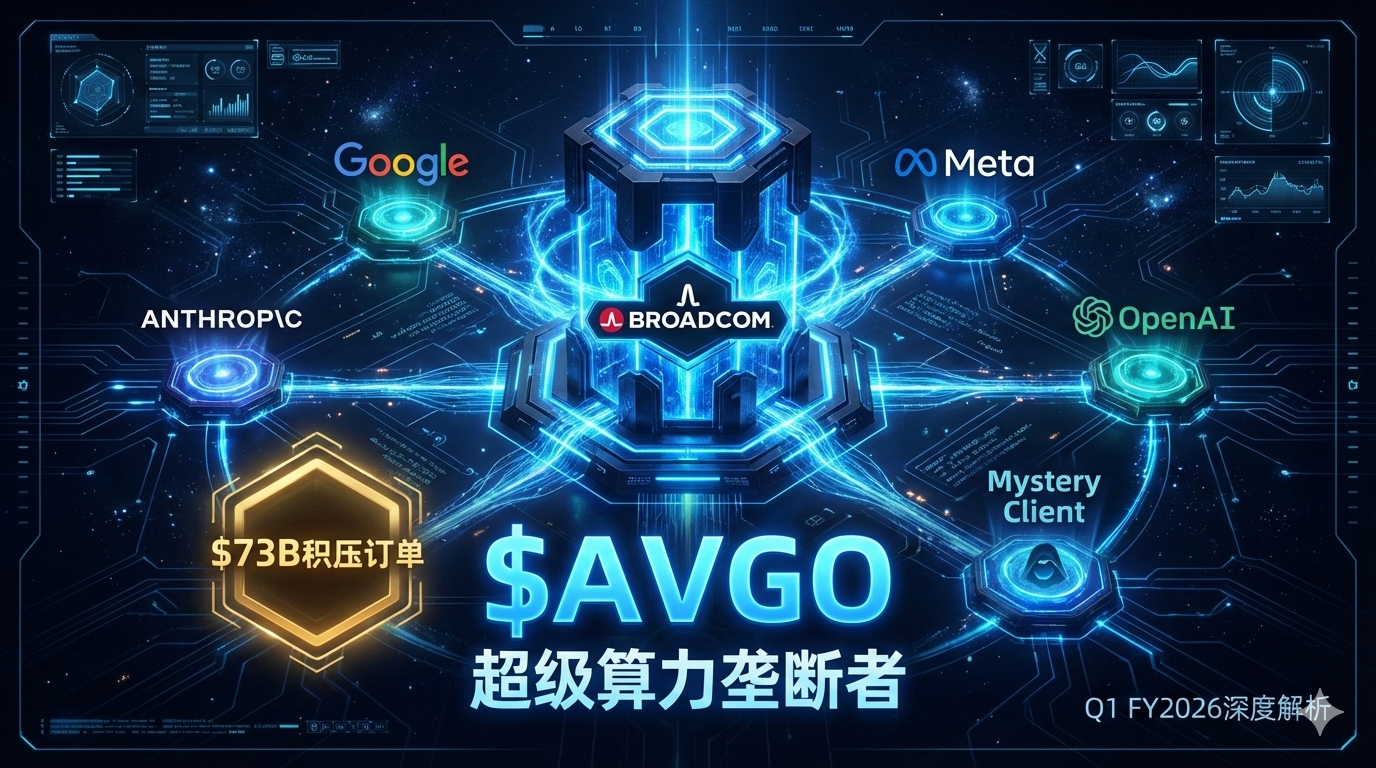
$AVGO: The Supercompute Monopolist the Market Hasn’t Priced In
Q1 FY2026 Earnings Deep Dive | March 4, 2026
Executive Summary
Initiate position immediately.
Broadcom’s ($AVGO) Q1 FY2026 earnings report released today is not an ordinary quarterly update — it is a strategic blueprint: the exclusive custom chip (XPU) supplier to all 5 major hyperscale AI labs, $73B in locked backlog, 68% EBITDA margins, and $26.9B in annual free cash flow. This is not an AI concept stock — this is the monopoly rent collector of AI infrastructure.
The stock is up +5% after-hours tonight, but the long-term repricing has barely begun.
TL;DR: - Recommended Action: Initiate position, begin scaling in at $333–350, double down below $290 - Core Key Force: Exclusive XPU supplier status to the world’s 5 largest AI supercompute customers — irreplaceable for at least 3 years - Primary Risk: Sudden disruption of AI capital expenditure cycle (probability <15%), or competitor technical catch-up (Marvell, not a threat within 2–3 years) - Valuation: Consensus target price $454, current $333 → implied return +36%, IRR ~36% — exceeds 15% hurdle rate
Key Forces
Force 1: XPU Exclusive Network Effects — The Iron Cage Around 5 Customers
This is the soul of the entire investment thesis and requires deep understanding.
Broadcom is not selling general-purpose GPUs (that is NVIDIA’s story). Broadcom builds custom ASIC chips (XPUs) — chips specifically tailored to a particular hyperscaler’s unique AI model architecture. This means:
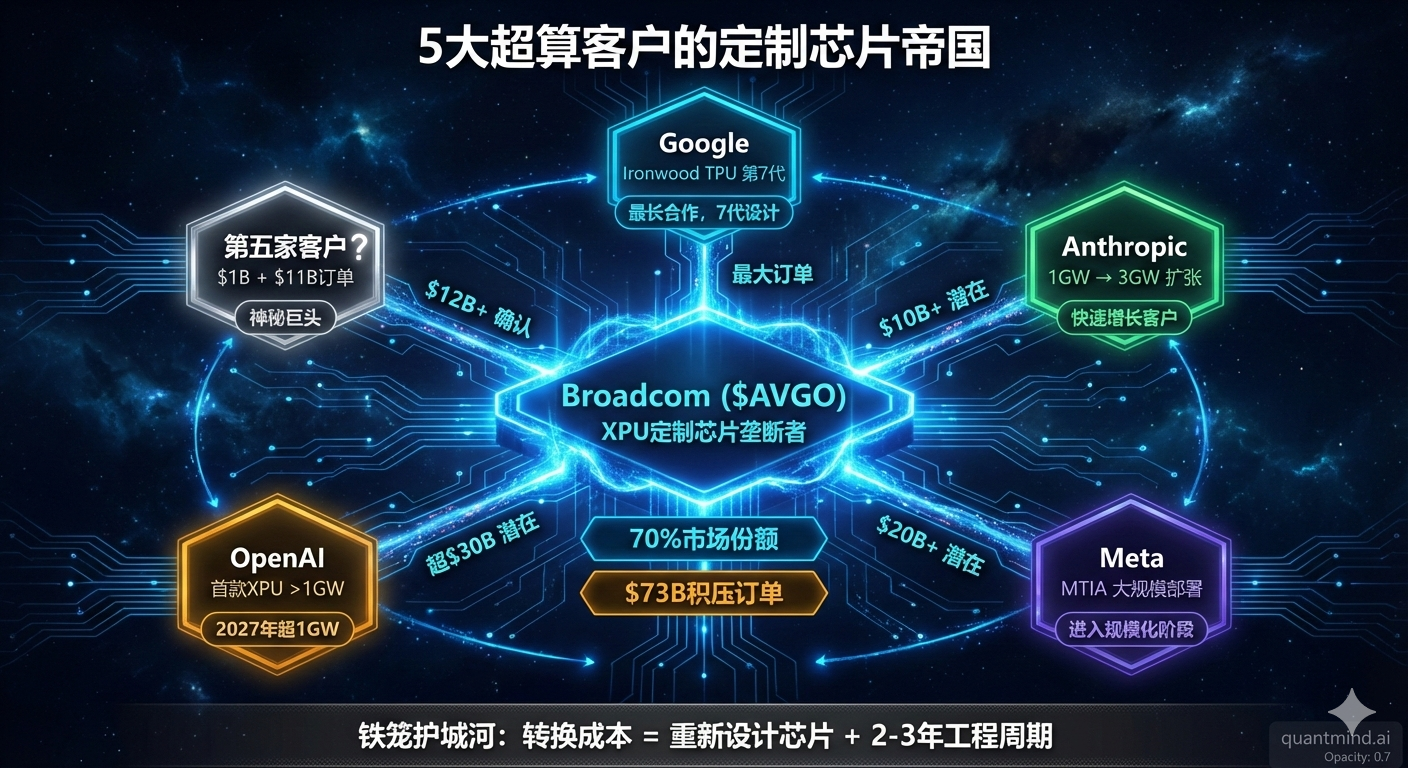
Confirmed 5 Major XPU Customers (disclosed in earnings): 1. Google — Ironwood TPU (7th generation), Broadcom has been deeply integrated across multiple generations 2. Anthropic — Currently at 1GW deployment, expanding to 3GW by 2027 3. Meta — MTIA chip, already in large-scale deployment 4. OpenAI — First XPU, set to exceed 1GW by 2027 5. Customer #5 — Placed $1B initial order + $11B follow-on (identity undisclosed)
These 5 customers collectively account for $73B in AI-related backlog. Each customer’s chip is a unique design — switching suppliers means retraining engineering teams, redesigning chip architecture, and a 2–3 year timeline — effectively infinite switching costs.
Market Share: Broadcom commands approximately 70% of the global custom ASIC/XPU market, with #2 Marvell at roughly 20% (primarily serving smaller customers).
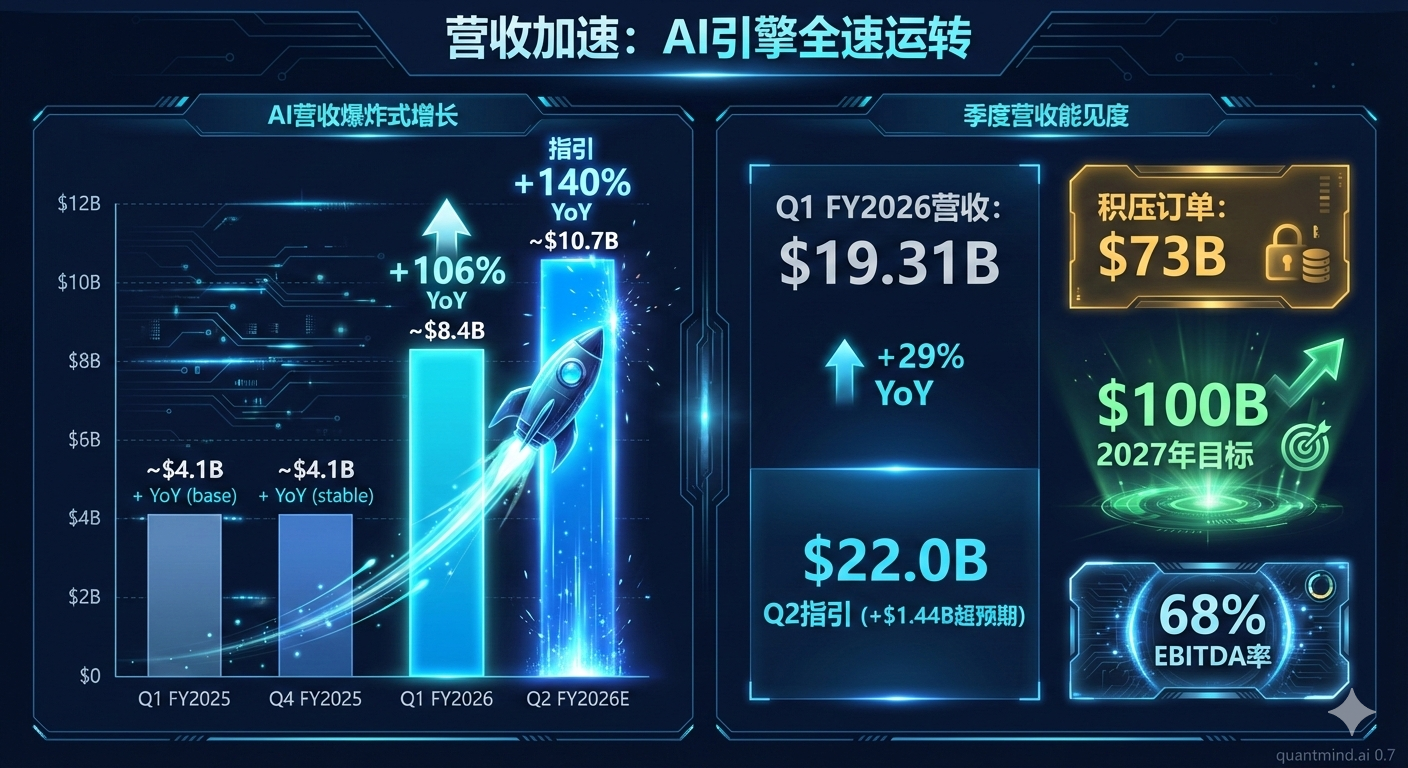
$100B Timeline Validation: - FY2025 AI Revenue: ~$12.2B - Q1 FY2026 AI Revenue: $8.4B (annualized $33.6B, +106% YoY) - Q2 FY2026 Guidance: AI revenue $10.7B (annualized $42.8B, +140% YoY) - 2027 Target: $100B (chips only, excluding VMware software)
Hock Tan is not telling stories. His 5 customers have each signed multi-year contracts — this $100B figure is underpinned by contractual visibility, not forecasts.
Investment Implication: For the next 3 years, if you want to build custom hardware for AI workloads, you almost certainly must go through Broadcom. This is a structural monopoly, not a transient market share lead.
Force 2: 68% EBITDA Margins — This Is Not a Semiconductor Company
This is the single greatest misunderstanding in the market’s valuation.
The market prices $AVGO as a “semiconductor company” and assigns a 30x PE multiple. But Broadcom’s true identity is:
| Business | FY2026E Revenue | EBITDA Margin | Nature |
|---|---|---|---|
| Semiconductors (AI XPU + Networking) | ~$58B | ~68% | Custom hardware + design IP |
| Infrastructure Software (VMware, etc.) | ~$29B | ~73% | Pure recurring SaaS |
| Combined | ~$87B | ~68% | Semiconductor + software hybrid |
Benchmarks: - Pure semiconductor companies (Intel, AMD): 30–40% EBITDA margins - Pure software/SaaS companies (Salesforce, ServiceNow): 30–40% EBITDA margins - Broadcom: 68% — the best of both worlds combined
VMware transformation nearing completion: - 70%+ of perpetual licenses converted to subscriptions - Annual recurring revenue (ARR) continuing to grow - Provides $AVGO with a hedge floor against AI semiconductor cycle volatility
Force 3: Hock Tan’s Capital Allocation Machine
“Tan-ism” is not a management style — it is a wealth compression engine:
- Acquire: Identify niche market leaders (CA Technologies 2018, Symantec 2019, VMware 2023)
- Streamline: Cut R&D unrelated to core, focus on high-EBITDA products
- Convert: Transform one-time licenses into subscription recurring revenue
- Compound: Deploy $26.9B annual FCF toward debt paydown + buybacks + reinvestment
FY2025 Free Cash Flow: $26.9B (larger than many companies’ total revenue)
Q1 FY2026 additions: - $10B new share repurchase program - Quarterly dividend $0.65 (+10.2%, 15 consecutive years of growth)
Insider transactions: Hock Tan sold 70,000 shares (~$24M) in January 2026 under a 10b5-1 plan — this is routine tax diversification, not a confidence signal. He still holds 908,474 shares (~$300M).
A. Revenue Scale and Quality
A1. Revenue Composition (Q1 FY2026)
| Business Line | Q1 FY2026 | Q1 FY2025 | YoY |
|---|---|---|---|
| Semiconductor Solutions | $12.52B | $8.22B | +52% |
| - AI (XPU + AI Networking) | $8.4B | $4.1B | +106% |
| - Non-AI Semiconductors | $4.12B | $4.12B | 0% |
| Infrastructure Software (VMware) | $6.79B | $6.67B | +2% |
| Total | $19.31B | $14.92B | +29% |
A2. Growth Trajectory
| Period | Revenue | YoY |
|---|---|---|
| FY2024 | $51.57B | +44% |
| FY2025 | $63.9B | +24% |
| Q1 FY2026 | $19.31B | +29% |
| Q2 FY2026E (Guidance) | ~$22.0B | +47% |
Growth is accelerating — this is the critical takeaway. The market expected deceleration; Broadcom delivered acceleration.
A3. Revenue Quality
- Recurring revenue mix: VMware subscriptions ($6.79B) + AI long-term contracts → approximately 60%+ of revenue has extremely high visibility
- $73B backlog provides 3–4 years of revenue visibility
- Geographic distribution: primarily U.S. (~60%), Asia-Pacific ~25%, Europe ~15%
B. Profitability and Margins
B1. Triple Margin Lines
| Metric | Q1 FY2026 | Q1 FY2025 | Trend |
|---|---|---|---|
| Gross Margin (Non-GAAP) | ~79% | ~77% | Expanding |
| Adjusted EBITDA Margin | ~68% | ~64% | Expanding |
| Non-GAAP Net Margin | ~56% | ~54% | Expanding |
GAAP vs. Non-GAAP Divergence: - GAAP net income is depressed by VMware intangible asset amortization (~$4B/quarter) - Non-GAAP EPS Q1: $2.05 (vs. consensus $2.03, slight beat) - The divergence stems primarily from accounting amortization of the VMware acquisition — a non-cash item with no impact on actual economic value
SBC as % of revenue: approximately 8% (within acceptable range, below most software peers)
B2. Quarterly EPS Tracker
| Quarter | Non-GAAP EPS | YoY |
|---|---|---|
| Q1 FY2025 | $1.42 | — |
| Q2 FY2025 | $1.60 | — |
| Q3 FY2025 | $1.24 | — |
| Q4 FY2025 | $1.42 | — |
| Q1 FY2026 | $2.05 | +44% |
| Q2 FY2026E | ~$2.60 | ~+63% |
C. Cash Flow and Capital Allocation
C1. Cash Flow Quality
| Metric | FY2025 | Notes |
|---|---|---|
| Operating Cash Flow | ~$29B | Robust |
| Free Cash Flow (FCF) | $26.9B | FCF margin ~42% |
| GAAP Net Income | ~$5.5B | Depressed by VMware amortization |
| FCF / GAAP Net Income | ~490% | Indicates exceptionally high earnings quality |
FCF far exceeds reported earnings because VMware’s $130B+ goodwill/intangible assets generate approximately $16B in annual non-cash amortization — this suppresses GAAP profits but has no impact on cash generation.
C2. Capital Structure
| Item | Amount |
|---|---|
| Total Debt | ~$67B |
| Cash | ~$10B |
| Net Debt | ~$57B |
| Net Debt / EBITDA | ~1.3x |
| Annual Debt Service Capacity | FCF $26.9B >> annual interest ~$3.5B |
The debt from the $69B VMware acquisition is being repaid at a remarkable pace. At the current FCF run rate, net debt can decline to negligible levels within 3 years.
C3. Capital Returns
- FY2025 share repurchases: ~$7B
- New $10B buyback program announced
- Quarterly dividend: $0.65 (+10.2%, 15 consecutive years of growth)
- Annualized dividend: $2.60/share, dividend yield ~0.78%
D. Forward Guidance and Management Signals
D1. Guidance Comparison
| Dimension | Q2 FY2026 Guidance | Wall Street Consensus | Beat Magnitude |
|---|---|---|---|
| Revenue | ~$22.0B | $20.56B | +$1.44B (+7%) |
| AI Revenue | ~$10.7B | ~$9.2B | +$1.5B (+16%) |
| Non-GAAP EPS | ~$2.60 | ~$2.40 | +$0.20 (+8%) |
Media Mislead Warning: Some media headlines claimed “guidance below expectations” — this is incorrect. Early Bloomberg reporting conflated GAAP and Non-GAAP figures. Q2 guidance of $22.0B actually exceeded Wall Street’s $20.56B consensus by a wide margin. The +5% after-hours move confirms this.
D2. Full-Year Guidance Raised
FY2026 full year: Hock Tan indicated full-year AI revenue will significantly exceed initial guidance, and the $100B 2027 target is “clearly within sight.”
D3. Management Tone
Key earnings call statements: - “The deployment demand from our 5 XPU customers far exceeds what we previously anticipated” - “By 2027, each of these customers will deploy clusters of over 1 million AI accelerators” - “We are in the early stages of the largest compute investment cycle in history”
Tone was noticeably more confident than last quarter, with specific customer-level figures rather than vague “strong AI demand” language.
E. Competitive Landscape and Industry Positioning
E1. Industry Map
Custom ASIC/XPU market: - TAM (2027): Estimated $200–300B (XPU market growing from near-zero to this level) - Broadcom market share: ~70% - #2 Marvell: ~20%, primarily serving smaller-scale customers
Why XPU growth is outpacing GPUs: General-purpose GPUs (NVIDIA): Ideal for training, versatile one-card-fits-all Custom XPUs: 3–5x more efficient for inference; hyperscalers increasingly favor custom solutions at the inference deployment stage
E2. Competitor Comparison
| Company | AI Custom Chips | Market Share | Threat Level |
|---|---|---|---|
| Broadcom | XPU (all 5 hyperscale customers) | 70% | — |
| Marvell | Custom ASIC (smaller customers) | 20% | Low (different segment) |
| Intel | Gaudi series | <5% | Very low (behind technologically) |
| NVIDIA | General-purpose GPU | Dominant in GPU market | Different market, complementary |
Key Insight: NVIDIA and Broadcom are not competitors — they are complements. The training phase uses NVIDIA GPUs; the inference deployment phase uses Broadcom XPUs. This is a “compute duopoly” structure.
E3. Moat Assessment
- Switching Costs (Strongest): XPUs are custom-designed for specific model architectures; switching suppliers is equivalent to redesigning the chip + retraining the team — a 2–3 year cycle with prohibitive costs
- Network Effects (VMware): An ecosystem of tens of thousands of independent software vendors (ISVs), built over decades and impossible to replicate
- Cost Advantage (R&D Efficiency): “Tan-ism” concentrates R&D on core competencies, generating far more value per R&D dollar than peers
- Brand: Decades of brand equity in enterprise IT infrastructure (routers, storage, virtualization)
F. Core Monitoring Metrics (KPI Dashboard)
| KPI | Q1 FY2026 | Q4 FY2025 | Q1 FY2025 | Trend |
|---|---|---|---|---|
| AI Revenue | $8.4B | $4.1B (Q4 FY2024) | $4.1B | Rapidly accelerating |
| AI Revenue YoY Growth | +106% | +74% | — | Accelerating |
| Backlog | $73B | — | — | — |
| Adj. EBITDA Margin | ~68% | ~64% | ~64% | Sustained expansion |
| FCF (TTM) | ~$27B | $26.9B | — | Stable growth |
| XPU Customer Count | 5 | 3 | 2 | Accelerating expansion |
Alert Trigger Thresholds: - If AI revenue YoY growth falls below 60% for two consecutive quarters → reassess thesis - If backlog declines quarter-over-quarter → reduce position immediately - If EBITDA margin falls below 65% → monitor cost structure
G. Core Products and Business Narratives
G1. XPU Core Products
Broadcom’s XPU business is fundamentally a combination of “custom compute design services + intellectual property licensing”: - Co-designs proprietary chip architectures with customers - Outsources fabrication to TSMC - Provides AI networking solutions (Tomahawk + Jericho switch families)
Credibility of Q2 FY2026 AI revenue guidance of $10.7B (+140% YoY): - Backed by locked contracts (not forecasts) - Each of the 5 customers has an independent procurement contract - Capacity determined by TSMC’s CoWoS advanced packaging technology, with stable supply
G2. VMware Software Engine
VMware transformation progress (key milestones): - Perpetual-to-subscription conversion: 70%+ complete - Target: 90%+ recurring revenue - Average enterprise contract length: 3–5 years - Retention rate: 90%+ (natural stickiness of enterprise IT infrastructure)
VMware is not a drag — it is a stabilizer — providing $AVGO with a 20–30% revenue base that serves as a floor during AI semiconductor cycle troughs.
G3. AI Narrative Integrity Check
- Clear AI revenue definition: The company distinguishes between AI XPU revenue and AI networking revenue, supported by customer-level deployment figures
- Customers transitioning from pilot to scale: Existing customers (Google, Anthropic, Meta) have moved from pilot runs to multi-GW scale deployment
- Not “slapping an AI label on legacy products”: XPUs are entirely new chip designs, not existing product lines with an AI prefix
H. Partnerships and Supply Chain Ecosystem
H1. Key Partnerships
| Partner | Relationship | Importance |
|---|---|---|
| TSMC | Exclusive foundry | Critical — advanced packaging (CoWoS) capacity is the binding constraint |
| Largest XPU customer | Critical — 7-generation partnership history, deeply integrated | |
| Anthropic | Fast-growing XPU customer | High — 1GW → 3GW expansion |
| Meta | XPU in deployment | High — multi-year contract |
| OpenAI | First XPU >1GW by 2027 | High — major new customer addition |
H2. Supply Chain Risks
- TSMC Concentration Risk: Broadcom is nearly 100% dependent on TSMC for advanced-node XPU production. Taiwan Strait risk is a real systemic concern.
- Mitigation: Broadcom is exploring partial capacity diversification, but near-term TSMC dependence is difficult to alter
H3. Potential Wild Cards
- Customer in-house design risk: Exists but is limited. The portions of Google’s self-designed TPU are precisely the parts Broadcom helps design — this is not competition, it is core business outsourced to Broadcom.
- Cloud hyperscaler in-house chips: AWS Trainium, Google TPU actually expand Broadcom’s addressable market (these chips are designed with Broadcom’s help)
I. Executive Team and Governance
I1. CEO Hock Tan
- Tenure: 2006 to present (20 years)
- Founder status: De facto founder-CEO after acquiring Broadcom
- Track record: Stock price appreciation exceeding 100x during tenure
- Compensation structure: Predominantly equity-based, strongly aligned with shareholder interests
- Holdings: 908,474 shares (~$300M market value, maintaining substantial skin in the game)
Hock Tan’s uniqueness: He is the closest thing to a value investor mindset among technology CEOs. He does not pursue “disruption” — he pursues “sustained compounding.”
I2. Governance Structure
- No dual-class share structure (unlike Meta, Alphabet)
- Strong board independence
- Recent reorganization: Redomiciled from Singapore to the U.S. (2020), reducing political risk
I3. Potential Red Flags
- Insider selling: Hock Tan has been selling on a consistent 10b5-1 plan (net sales of 1.34M shares over the past 18 months). This is routine wealth management, not a negative signal — he still holds shares worth $900M.
- Antitrust: EU opened an investigation in 2024 into bundling practices following the VMware acquisition; no conclusions yet. Risk is present but manageable.
J. Macro and Policy Impact
J1. Federal Reserve Policy
Current macro liquidity status: Ample
| Indicator | Status | Signal |
|---|---|---|
| Fed Net Liquidity | Rising (QT ended March 2025) | Normal |
| SOFR | Within fed funds rate corridor | Normal |
| MOVE Index | ~90 (below 100 warning threshold) | Normal |
| Yen Carry Trade | USDJPY ~148–150, stable | Normal |
Composite Liquidity Rating: 0/4 warnings = Ample
A declining rate cycle is doubly positive for $AVGO: (1) lower discount rates lift valuations; (2) expanding enterprise IT budgets benefit VMware sales.
J2. AI Policy Environment
- Biden-era “AI chip export controls”: Impact NVIDIA far more (general-purpose GPU exports to China); Broadcom’s XPUs primarily serve U.S. hyperscalers, with minimal export control exposure
- CHIPS Act: Incentivizes U.S.-based semiconductor production, but Broadcom designs in the U.S. and manufactures in Taiwan — limited direct benefit
- AI safety regulation: No material policy risk at present
J3. Geopolitics
- Taiwan Risk: The sole major geopolitical risk — TSMC capacity concentration in Taiwan. However, this is a systemic risk for the entire semiconductor industry, not unique to Broadcom.
- U.S.–China Relations: Broadcom’s primary business serves U.S. hyperscale customers, minimizing exposure to U.S.–China friction
K. Valuation Matrix
K1. Multi-Method Valuation Comparison
| Method | Current Value | Fair Value / Signal | Assessment |
|---|---|---|---|
| Forward PE (FY2026E $11/share) | 30x | Comparable peers (30–40x) | Reasonable to low |
| EV/EBITDA (FY2026E $59B) | 26.5x | High-quality compounder: 30–35x | Low |
| P/FCF (FY2026E $38B) | 40x | High-growth, high-quality: 35–45x | Reasonable |
| Reverse DCF | Implied growth ~12% | Actual expected growth >30% | Significantly undervalued |
| Sum-of-the-Parts (SOTP) | — | Detailed below | 30%+ discount |
K2. SOTP Valuation
| Business | FY2026E | Valuation Multiple | Valuation |
|---|---|---|---|
| AI Semiconductors (XPU) | ~$58B revenue | 50x revenue (monopolistic AI infrastructure) | ~$1,740B |
| VMware Software | ~$29B revenue | 10x revenue (enterprise SaaS) | ~$290B |
| Total EV | ~$2,030B | ||
| Less: Net Debt | -$57B | ||
| Equity Value | ~$1,973B | ||
| Per-Share Value (~2.14B shares) | ~$922 |
Note: The SOTP valuation represents the upper bound, assuming full segment-level market precedent pricing. More conservative base-case estimates are provided in the scenario analysis below.
K3. Comparable Company Multiples
| Company | Forward PE | EV/EBITDA | Revenue Growth | Notes |
|---|---|---|---|---|
| $AVGO | 30x | 26.5x | +47% (Q2 guidance) | |
| $NVDA | ~35x | ~30x | +100%+ | GPU, faster growth, premium justified |
| $META | ~24x | ~18x | +20% | Social media, slower growth |
| $MSFT | ~30x | ~25x | +15% | Software, slower growth |
| $MRVL | ~38x | ~32x | +40–50% | Custom chips, smaller customer base, lower quality |
Conclusion: $AVGO has the highest growth rate among peers (47%+ and accelerating), yet trades at one of the lowest PE multiples. Marvell operates a similar business (custom chips) at 38x PE, while Broadcom (higher quality, larger scale, wider moat) trades at only 30x — a clear market mispricing.
K4. Sensitivity Analysis
FY2027E Target Price Matrix (based on various AI revenue realization rates x PE multiples):
| 25x PE | 30x PE | 35x PE | |
|---|---|---|---|
| AI Revenue $70B | $320 | $384 | $448 |
| AI Revenue $100B | $440 | $528 | $616 |
| AI Revenue $130B | $560 | $672 | $784 |
(Based on overall EPS estimates corresponding to AI revenue achievement levels)
K5. Probability-Weighted Scenario Analysis
| Scenario | Probability | Target Price | Implied Return | Key Assumptions |
|---|---|---|---|---|
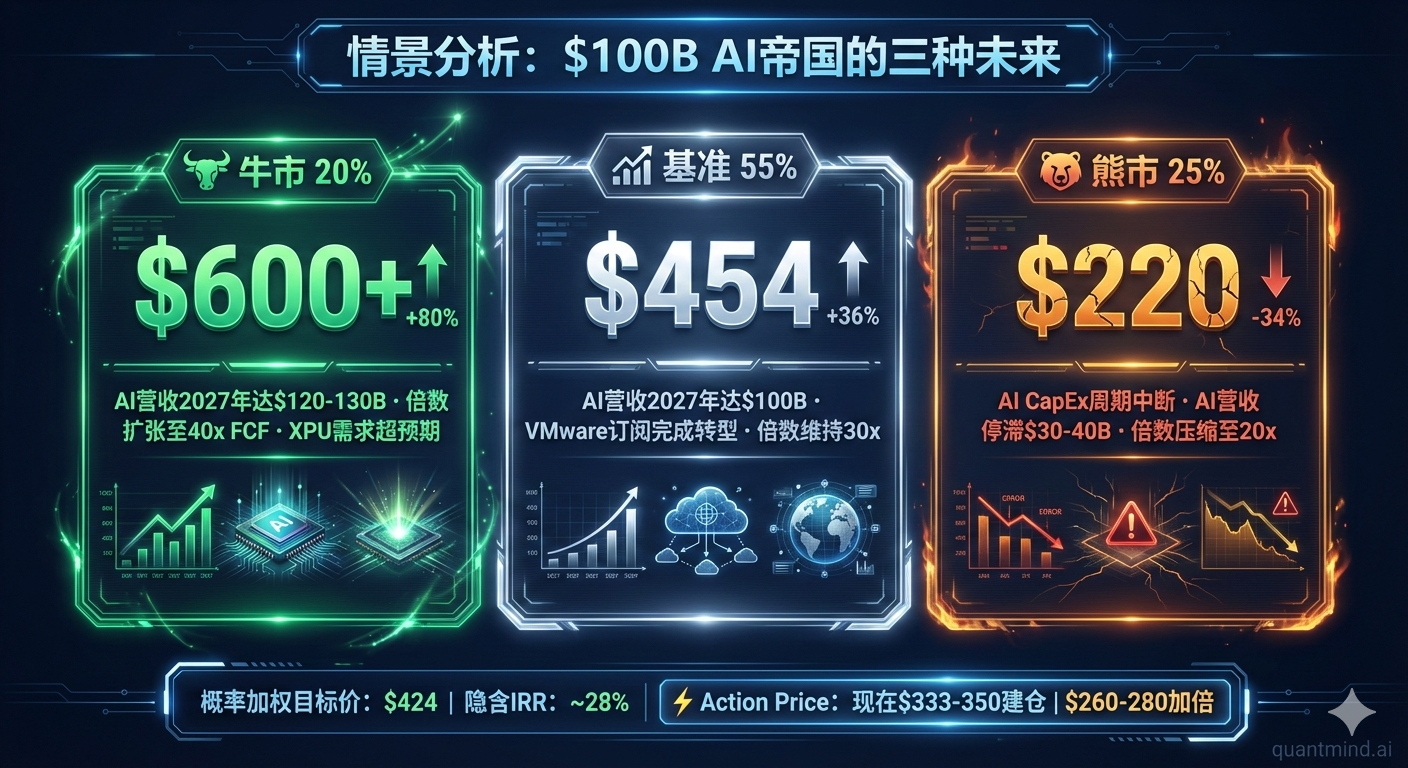
| Bull Case | 20% | $600+ | +80%+ | AI revenue reaches $120–130B by 2027; multiple expansion to 40x |
| Base Case | 55% | $454 | +36% | AI revenue reaches $100B by 2027; multiple holds at 30x |
| Bear Case | 25% | $220 | -34% | AI CapEx cycle disruption; AI revenue stalls at $30–40B |
Probability-Weighted Expected Return: - ($600 x 20%) + ($454 x 55%) + ($220 x 25%) = $120 + $249.7 + $55 = $424.7 - Relative to current price of $333: implied return +27.5% - Implied IRR: ~28% — significantly exceeds 15% hurdle rate
U.S. Value Investing Four-Dimensional Scorecard
| Dimension | Data | Score | Commentary |
|---|---|---|---|
| ROE Sustainability | Non-GAAP ROE estimated >40% (sustained over multiple years); GAAP ROE ~22% due to VMware amortization but stable | 3/3 | Exceptional quality, consistently exceeds 20% threshold |
| Debt Safety | Total debt $67B, total assets ~$167B, leverage ratio ~40%; but FCF of $26.9B enables rapid deleveraging | 2/3 | Elevated due to VMware acquisition, but improving rapidly |
| FCF Quality | FCF $26.9B vs. GAAP net income $5.5B → FCF/net income ~490% | 3/3 | Outstanding; VMware amortization is purely non-cash |
| Moat | XPU switching costs + VMware network effects + R&D efficiency + enterprise brand → four-layer moat stack | 3/3 | Wide moat, multi-layered defense |
Total Score: 11/12 = A-Grade
From a value investing perspective: Broadcom is a rare “high growth + wide moat + high FCF quality” trifecta. The only deduction is the temporarily elevated debt from the VMware acquisition, but $26.9B in annual FCF ensures rapid deleveraging.
U.S. Market Sentiment Dashboard
| Indicator | Current Value | Status | Signal |
|---|---|---|---|
| NAAIM Exposure Index | ~71 (February data, down from 78 peak) | Elevated but declining | Watch |
| Institutional Equity Allocation | Near historical high range | Elevated | Warning |
| Retail Net Buying | >85th historical percentile | Overheated | Warning |
| S&P 500 Forward PE | ~21x | Elevated | Warning |
| Hedge Fund Leverage | Moderate levels, not at historical extremes | Normal | Normal |
Composite Market Sentiment Rating: 3/5 warnings = Greed
Stock-Specific Overlay: The broader market is in a greed state, which means vigilance is warranted for any new position. However, $AVGO just delivered a beat-and-raise quarter, providing a stock-specific catalyst that justifies initiating a disciplined, staged position in a high-quality name even during periods of elevated market-wide greed — rather than chasing the move.
L. Ownership Distribution
L1. Shareholder Structure
- Institutional ownership: ~76%
- Insider ownership: Hock Tan + other executives ~0.7%
- Retail: ~23%
L2. Major Institutional Holders (as of latest 13F)
- Vanguard: ~9%
- BlackRock: ~8%
- State Street: ~4%
- Multiple prominent value/growth funds (Wellington, Fidelity, etc.)
L3. Long/Short Positioning
- Short interest: ~1.5% (very low)
- Days to Cover: ~2 days
- Short sentiment: Almost nobody is short AVGO (fundamentals are too strong)
L4. Insider Activity
Hock Tan’s sales (10b5-1 plan, systematic): - January 2026: 70,000 shares, ~$24M - Past 18 months: ~1.19M shares net sold - Key point: He still holds 908,474 shares (~$300M); the ongoing “sales program” represents normal wealth diversification, not a loss of conviction
L5. Liquidity
- Average daily volume: ~$4–5B
- Average daily turnover: Among the highest-liquidity stocks globally
- For ordinary investors: Positions of any size can be built or exited without liquidity constraints
Variant View
Market Consensus: Broadcom is a high-quality diversified semiconductor + software company riding AI tailwinds to above-consensus growth, warranting a ~30x PE (in line with premium semiconductor stocks).
Our View: Broadcom is no longer a semiconductor company. It is the exclusive monopoly provider of AI supercompute infrastructure, while simultaneously owning a SaaS-like high-margin software business. This combination is historically unprecedented — possessing both the explosive growth trajectory of hardware and the high visibility and deep moat of software.
Why the Market Is Wrong: 1. Analyst inertia: Most analysts covering AVGO come from semiconductor research teams, applying semiconductor valuation methodologies (PE multiples) to a company that should partially be valued on software multiples 2. The embedded value of the backlog is being ignored: $73B in locked backlog represents 4.8% of current market cap. This means the next 3 years of AI revenue is essentially “already earned” — just not yet recognized in financial statements 3. The credibility of the $100B target is underappreciated: The market views this figure through a “management hype” lens, but 5 hyperscale customer contracts, TSMC capacity reservations, and existing quarterly delivery data all validate the plausibility of this trajectory
Six Investment Philosophy Perspectives
| Perspective | Conclusion | Core Rationale | Primary Risk |
|---|---|---|---|
| Quality Compounding (Buffett) | LONG | Ultra-wide moat, 68% EBITDA, sustained ROE >20%, Hock Tan is a world-class capital allocator | Legacy debt from VMware acquisition at a premium price |
| Imaginative Growth (Baillie Gifford) | LONG | $100B AI chips + $29B VMware software = future revenue at the $130B level, potentially one of the largest industrial companies in history | Sudden reversal of AI CapEx cycle |
| Fundamental Long/Short (Tiger Cubs) | LONG | Variant View: the market is pricing a hybrid monopoly using semiconductor PE; $73B backlog is insufficiently valued | Marvell’s technical catch-up arrives earlier than expected |
| Deep Value (Klarman) | LONG/PASS | FCF $26.9B; a private buyer would bid well above current market cap. But not cheap — requires a pullback | Without a catalyst, the stock may trade sideways to digest gains |
| Catalyst-Driven (Tepper) | LONG | Today’s Q1 FY2026 beat + significantly raised Q2 guidance = 6–12 month upward repricing catalyst | Macro risk causing broad market decline that suppresses the stock |
| Macro Tactical (Druckenmiller) | LONG | Macro liquidity is ample (QT ended), AI CapEx is the strongest capital flow theme, $AVGO is a direct beneficiary | Fed turns hawkish, liquidity tightens |
6/6 perspectives are LONG — this is extremely rare within the analytical framework and further strengthens conviction to initiate a position.
Pre-Mortem: If We Lost Money in 2 Years
Failure Path A (Highest probability, ~15%): AI CapEx Cycle Slams the Brakes - Hyperscale cloud providers (Google, Meta, Microsoft, Amazon) drastically cut AI hardware procurement budgets due to below-expected ROI - AI revenue retreats from $8.4B/quarter to $3–4B/quarter - Stock could decline from $333 to $150–200 - Early warning signal: Any major customer’s annual CapEx guidance reduced by >20%
Failure Path B (Probability ~10%): Marvell Catches Up Faster Than Expected - Marvell expands XPU customer count from 4 to 8 within 3 years, eroding Broadcom’s monopoly position - Simultaneously, hyperscale customers increase in-house design efforts - Stock derated from premium (30x PE) to industry average (20x PE) - Early warning signal: Marvell announces a new hyperscale XPU contract exceeding $1B
Failure Path C (Probability ~5%): Geopolitical / Taiwan Strait Risk - Taiwan Strait situation deteriorates; TSMC capacity is disrupted - Broadcom’s XPU production comes to a complete halt; customers forced to seek alternatives - This is a tail risk, nearly impossible to hedge - Early warning signal: U.S.–China military tensions escalate; TSMC announces production interruptions
Anti-Bias Check
Biases to Guard Against
- Narrative fallacy: The “XPU monopoly” story is extremely compelling and may lead to excessive optimism. Continuously verify that actual quarterly data aligns with the narrative
- Recency bias: Q1 FY2026’s extraordinary growth (+106% AI revenue) may lead to overestimation of sustainability. Growth will eventually normalize
Risks to Monitor
- VMware integration risk: The 70% perpetual-to-subscription conversion is not yet complete; execution risk remains on the final 30%
- Insider selling: Hock Tan continues selling on his 10b5-1 plan — while this is systematic, the volumes are not trivial
- The broader market is in the “greed” zone; any new position requires disciplined staged entry
Reassuring Signals
- FCF quality: $26.9B annual FCF far exceeds GAAP earnings; cash generation capability is unassailable
- Analyst consensus: All 48 ratings are “buy,” 0 “sell” — a rare unanimous consensus
- Management credibility: Hock Tan’s $100B 2027 target is backed by contract data, not empty promises
M. Long-Term Monitoring Variable Checklist
Incremental Drivers
| # | Driver | Tracking Metric | Current Baseline | Review Frequency |
|---|---|---|---|---|
| 1 | XPU customer AI deployment scale | Quarterly AI revenue (YoY%) | Q1: $8.4B (+106%) | Quarterly |
| 2 | Backlog health | Total backlog (QoQ) | $73B | Quarterly |
| 3 | VMware subscription conversion | Recurring revenue mix | 70% converted | Quarterly |
| 4 | EBITDA margin | Adjusted EBITDA margin | 68% | Quarterly |
| 5 | Hyperscale customer AI CapEx | 5 major customers’ quarterly CapEx guidance | All maintained or raised | Quarterly (with earnings) |
Potential Landmines
| # | Risk Factor | Early Warning Signal | Impact Magnitude |
|---|---|---|---|
| 1 | AI CapEx cycle reversal | Any major customer CapEx guidance cut >20% | Stock -30% to -50% |
| 2 | Marvell technology breakthrough | Marvell announces hyperscale contract >$2B | Multiple compression -20% |
| 3 | VMware customer churn | Software revenue declines QoQ for 2 consecutive quarters | Stock -10% to -20% |
| 4 | Taiwan Strait risk | Political tensions escalate to military standoff | Systemic risk, market-wide |
| 5 | Hock Tan health / departure | Major personnel announcement | Short-term -20%, long-term depends on successor |
Action Triggers
| Signal | Action | Size |
|---|---|---|
| Current price $333–350 | Initiate position | 30% of target allocation |
| AI revenue YoY growth >80% for two consecutive quarters | Add | +20% |
| Q2 FY2026 AI revenue >$11B | Add | +10% |
| Stock pulls back to $290–310 (technical support) | Add | +20% |
| Stock pulls back to $260–280 (macro panic) | Double down | +20% |
| AI revenue YoY <50% for 2 consecutive quarters | Reduce | -50% |
| Any major XPU customer CapEx cut >20% | Reduce | -50% |
| Backlog declines QoQ for 2 consecutive quarters | Exit | Full position |
| Marvell announces >$5B hyperscale XPU contract | Exit | Full position |
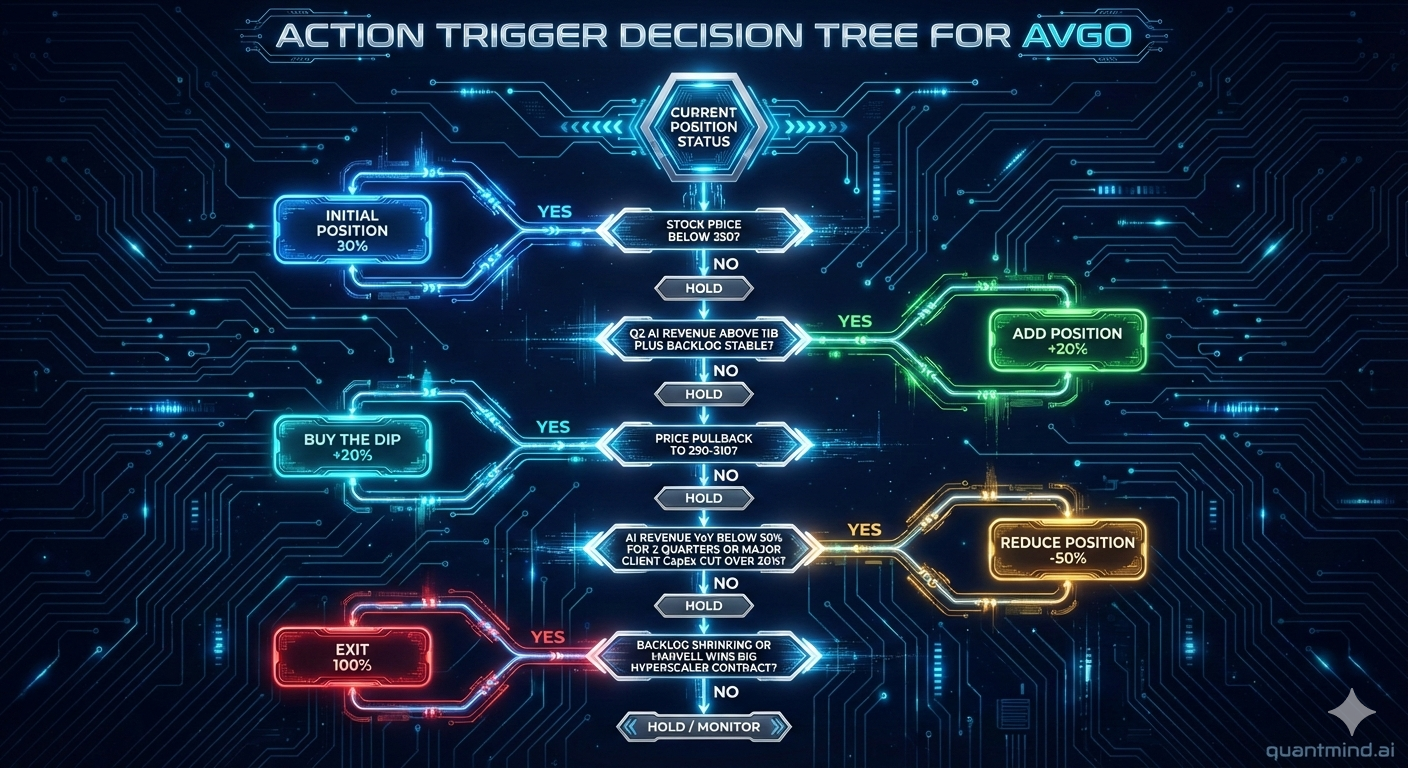
Decision Framework
Position Classification: Core Holding — AI infrastructure monopolist, worthy of 15–20% of technology allocation
Action Price Analysis (derived independently of current stock price): 1. FY2026E FCF: $38–42B (conservative) 2. Reasonable P/FCF multiple (high-quality compounder): 38–42x 3. Fair value range: $38B x 40 = $1.52T → $38B x 42x = $1.596T 4. Per-share fair value: $1.52T / 2.14B shares = $710 → less 30% margin of safety = $497 → Action Price
Current price of $333 is well below the $497 margin-of-safety entry price, providing ample downside cushion.
Position Sizing Plan (total 100% of target allocation): 1. Now ($333–350): 30% — earnings beat provides catalyst 2. $290–310: +20% — on market pullback 3. $260–280: +20% — macro panic buying opportunity 4. Post Q2 FY2026 earnings beat: +30% — trend validation
Allocation: 15–20% of technology portfolio (high conviction, wide moat, meets IRR hurdle)
Evidence Sources
| # | Source | Type | Summary |
|---|---|---|---|
| 1 | Broadcom Q1 FY2026 Earnings Release (2026-03-04) | Primary / Factual | Revenue, AI revenue, guidance, and other core data |
| 2 | Broadcom Earnings Call Transcript Q1 FY2026 | Primary | Hock Tan’s direct quotes, 5-customer confirmation, $100B pathway |
| 3 | SEC Form 4 Filings (Hock Tan, 2025–2026) | Factual | Insider transaction records |
| 4 | Broadcom FY2025 Annual Report (10-K) | Factual | Full-year financials, VMware integration progress |
| 5 | Bloomberg, WSJ (2026-03-04 earnings coverage) | Opinion | Market reaction and initial analyst commentary |
| 6 | 48 Analyst Target Price Compilation | Opinion | Consensus target $454, 48 buy / 0 sell |
| 7 | Marvell Competitive Analysis Report | Opinion | Market share comparison and technology roadmap |
Disclaimer: This analysis is based on publicly available information and model estimates, provided for research purposes only. It does not constitute investment advice. Investing involves risk; exercise due diligence before making decisions.