Feb 4, 2026
Quantitative Autopsy of the 1929 Crash: When 10x Leverage Met 4-Hour Latency
Rebuilding the 1929 crash in spreadsheets reveals a mass liquidation event disturbingly similar to modern flash crashes. From 10% margin's negative convexity to Stock Pool manipulation, 4-hour ticker tape delays, and failed rescue operations — the primitive algorithms of a century ago share the same DNA as today's 0DTE gamma squeezes.
Quantitative Autopsy of the 1929 Crash: When 10x Leverage Met 4-Hour Latency
I spent a weekend rebuilding the 1929 crash in spreadsheets — margin ratios, call triggers, interbank lending rates, ticker tape throughput. I expected a history lesson. What I got was a mass liquidation event that looks disturbingly like a modern flash crash, just running on ticker tape instead of fiber optic.
The “primitive algorithms” of a century ago and today’s 0DTE gamma squeezes share the same DNA. The more I dug into the data, the more unsettling it became.
The Leverage Machine
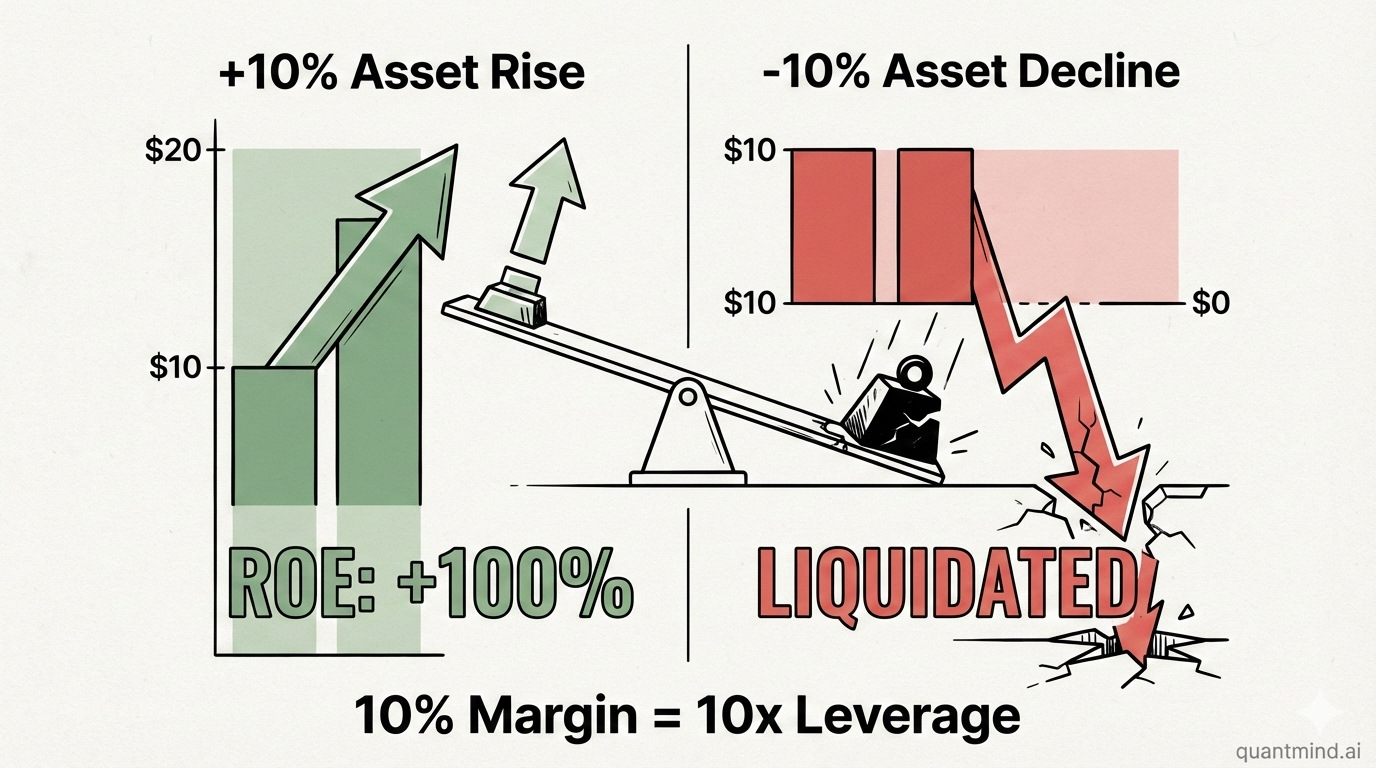
The 1920s bull market engine wasn’t earnings growth. It was an insane institutional design: 10% margin to go all-in.
Here’s the math:
You put up $10 in principal, control a $100 position. Cost of capital is roughly 20% annualized. If the asset rises 10%, you make $10 — a 100% return on equity. But if it drops 10%, you lose $10, your principal is wiped, and you’re forcibly liquidated. Not gradually. Immediately.
This isn’t investing. It’s a zero-margin-for-error bet. In options language, it’s a deeply negative convexity structure — capped upside (because funding costs eat most of the gains), cliff-edge downside.
Yet everyone was playing this game. Shoeshine boys were recommending stocks. Taxi drivers were discussing margin accounts. Everyone thought they’d cracked the wealth code.
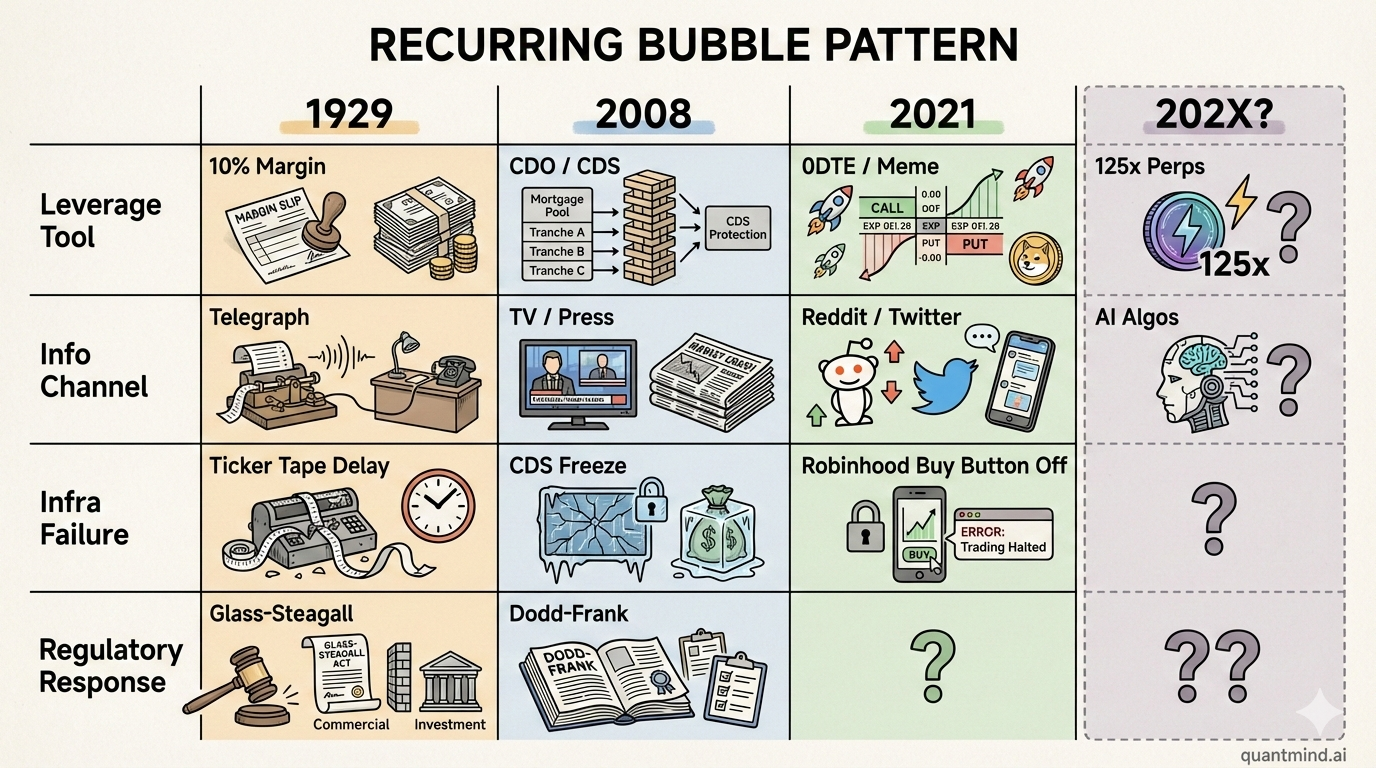
The 2021 scene should ring a bell. Retail traders on Robinhood using zero-commission trades plus weekly options for delta leverage — structurally identical to 1929’s 10% margin. Both use minimal capital to control maximum exposure, betting on short-term direction. Crypto’s 125x perpetual futures take it even further.
The instruments changed. The leverage math didn’t.
The Manipulation Playbook
The era had something called “Stock Pools” — essentially coordinated manipulation by syndicates of large operators.
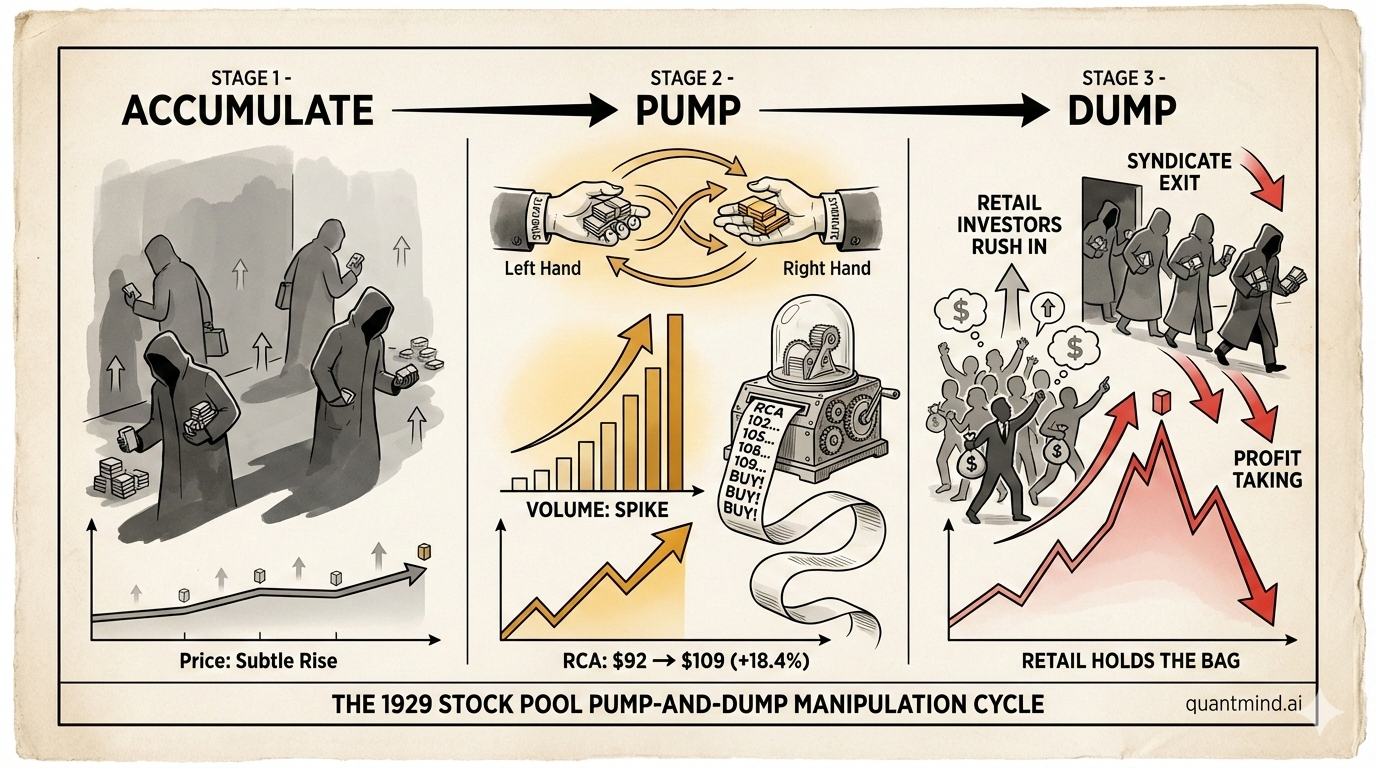
The mechanics were crude but effective: a group of big players would cross-trade shares among themselves, artificially inflating volume. The ticker tape would show heavy activity, creating the illusion of genuine demand, drawing retail traders in as exit liquidity.
The most notorious case was RCA (Radio Corporation of America), run by the “RCA Pool” under Michael Meehan:
- Accumulation phase: Quietly building positions at low prices.
- Pump phase: Internal cross-trades pushed the stock from $92 to $109 in a single week — an 18.4% ramp. The ticker showed surging volume that looked like real market demand.
- Dump phase: Retail saw the volume-price confirmation and piled in. The syndicate sold everything into the retail bid. Retail became the bag holders.
The core mechanic was exploiting retail’s lagged response to volume signals. The operators knew retail would chase “high volume + rising price,” so they manufactured the volume first, then sold real shares into the incoming flow.
Sound familiar?
During the 2021 meme stock frenzy, WSB posts on Reddit manufactured FOMO. Retail flooded into GME, AMC — and some early-positioned large holders cashed out at the top. In crypto, KOL pump-and-dumps and project teams engineering liquidity exits use virtually the same playbook as 1929’s stock pools.
The only difference is information propagation speed: 1929 relied on telegraphs and word of mouth. Today it’s Twitter and Telegram, compressing days into minutes. But the speed of retail chasing momentum? A century later, no improvement whatsoever.
Black Thursday: 4 Hours in the Dark
On October 24, 1929, what turned a selloff into a massacre was something you might not expect: bandwidth.
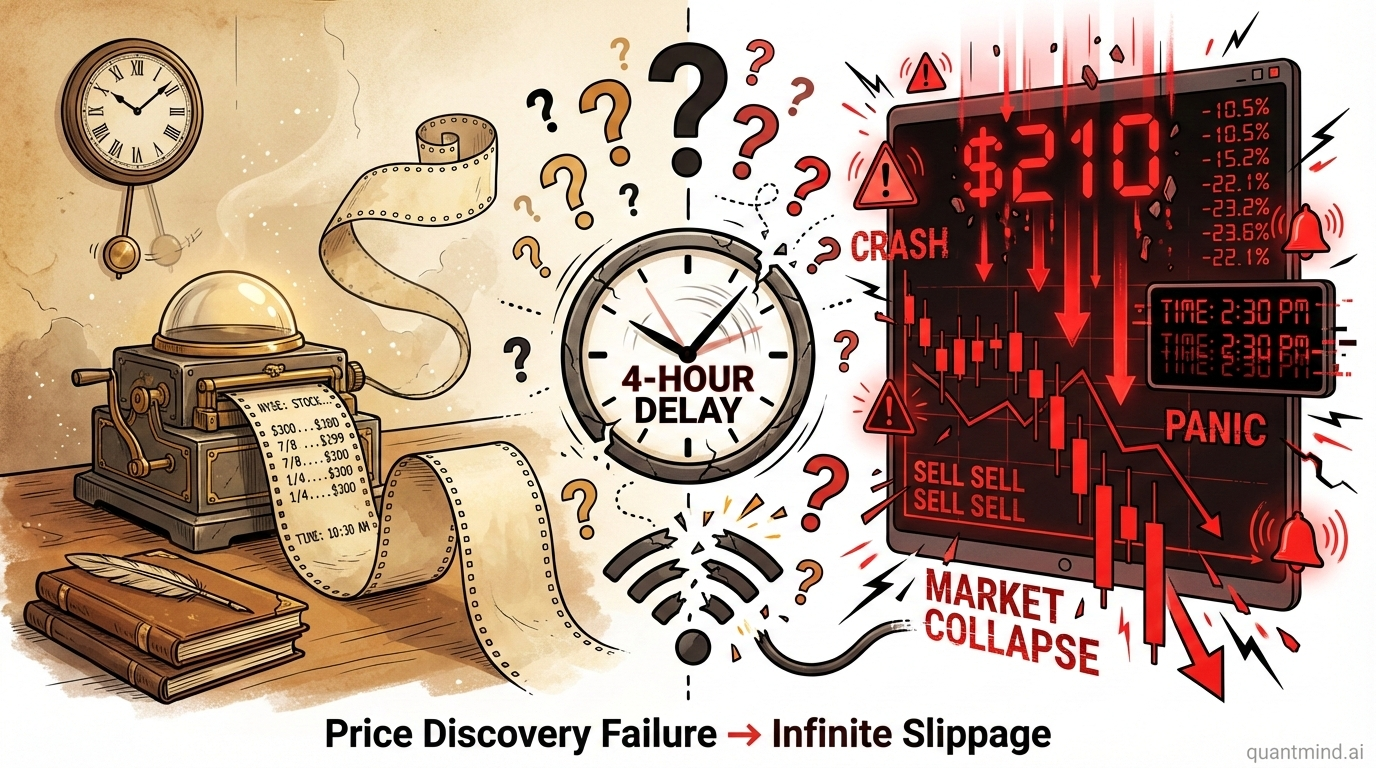
The day’s sell order volume vastly exceeded the ticker tape’s processing capacity. The machine could print roughly 285 characters per minute — adequate for normal trading, completely overwhelmed during a panic.
The result: price quotes were delayed by up to 240 minutes. Four full hours.
What does a 4-hour delay mean in practice?
Imagine you’re trading NVIDIA today, but your screen shows 10am prices and it’s actually 2pm — the stock has already dropped 30%. You don’t know the real price. You don’t know if your stop-loss was triggered. The only information you have: the trading floor is packed, everyone is screaming “sell.”
What do you do?
You can’t see anything, but you know everyone is running. So you run too. You submit sell orders at any price, because “unknown price” is more terrifying than “confirmed 30% loss.”
That was Black Thursday. Thousands of traders panic-selling blind. Price discovery completely broken. Slippage approaching infinity. Sell orders ate through every layer of bids. Prices fell like objects in vacuum.
This was the most primitive flash crash — not caused by algorithms, but by information vacuum.
But wait — have modern markets actually solved this problem?
On May 6, 2010, the Dow plunged nearly 1,000 points in 36 minutes. The cause? High-frequency trading algorithms stampeding each other as liquidity evaporated. Market makers pulled all quotes within seconds. Procter & Gamble briefly traded at $0.01. Accenture dropped to a penny.
In January 2021, during the GME short squeeze, Robinhood shut off the buy button entirely. Not because of a regulatory order — because the clearinghouse margin requirements spiked and Robinhood’s capital couldn’t cover it.
1929: ticker tape bandwidth insufficient. 2010: algorithmic quote withdrawal too fast. 2021: clearing system capital couldn’t match volatility.
Different eras, same problem: when stress arrives, infrastructure is always the first point of failure.
The Rescue: A Bucket Against Niagara Falls
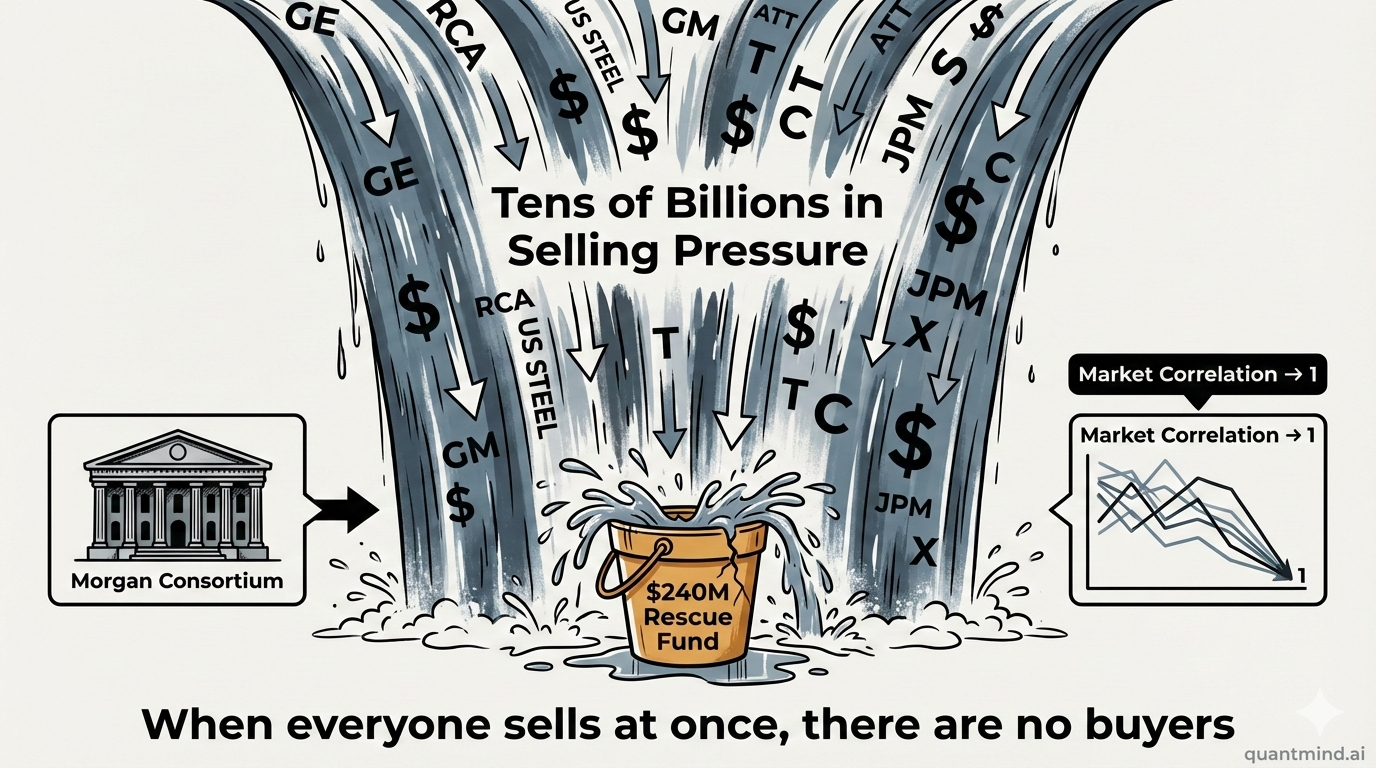
On Black Thursday, Morgan Bank organized a banking consortium to intervene.
Their strategy: aggressively buy US Steel at $205, attempting to stabilize sentiment through visible market-making — if the market saw a large buyer absorbing supply, the panic might ease.
It worked for a few hours. But by the following week’s Black Tuesday (October 29), the full collapse resumed, and the consortium’s ammunition was spent.
The failure was brutal and simple: scale mismatch.
The consortium pooled roughly $240 million in liquidity. Sounds substantial? Total market selling pressure was in the tens of billions. They were trying to catch Niagara Falls with a bucket.
The deeper issue: when correlation across all assets approaches 1 — when everyone is selling the same things, when everyone needs cash simultaneously — no single buyer can absorb systemic selling pressure. The core assumption of market-making is “for every seller there’s a buyer.” In extreme panic, buyers simply vanish.
After Lehman’s collapse in 2008, we saw the identical dynamic. The CDS market froze. Interbank lending halted. Everyone hoarded cash. The Fed ultimately had to deploy trillions in balance sheet expansion to become the buyer.
In March 2020, the COVID panic triggered a selloff so severe that even US Treasuries — the world’s consensus “safe asset” — experienced a liquidity crisis. The Fed bought over $1 trillion in Treasuries and MBS within two weeks.
The 1929 lesson: when everyone needs to sell simultaneously, no private-sector liquidity pool is large enough. Only a central bank’s unlimited firepower can absorb systemic selling pressure. But the 1929 Fed lacked both the awareness and the tools.
After the First Domino: The Credit Multiplier in Reverse
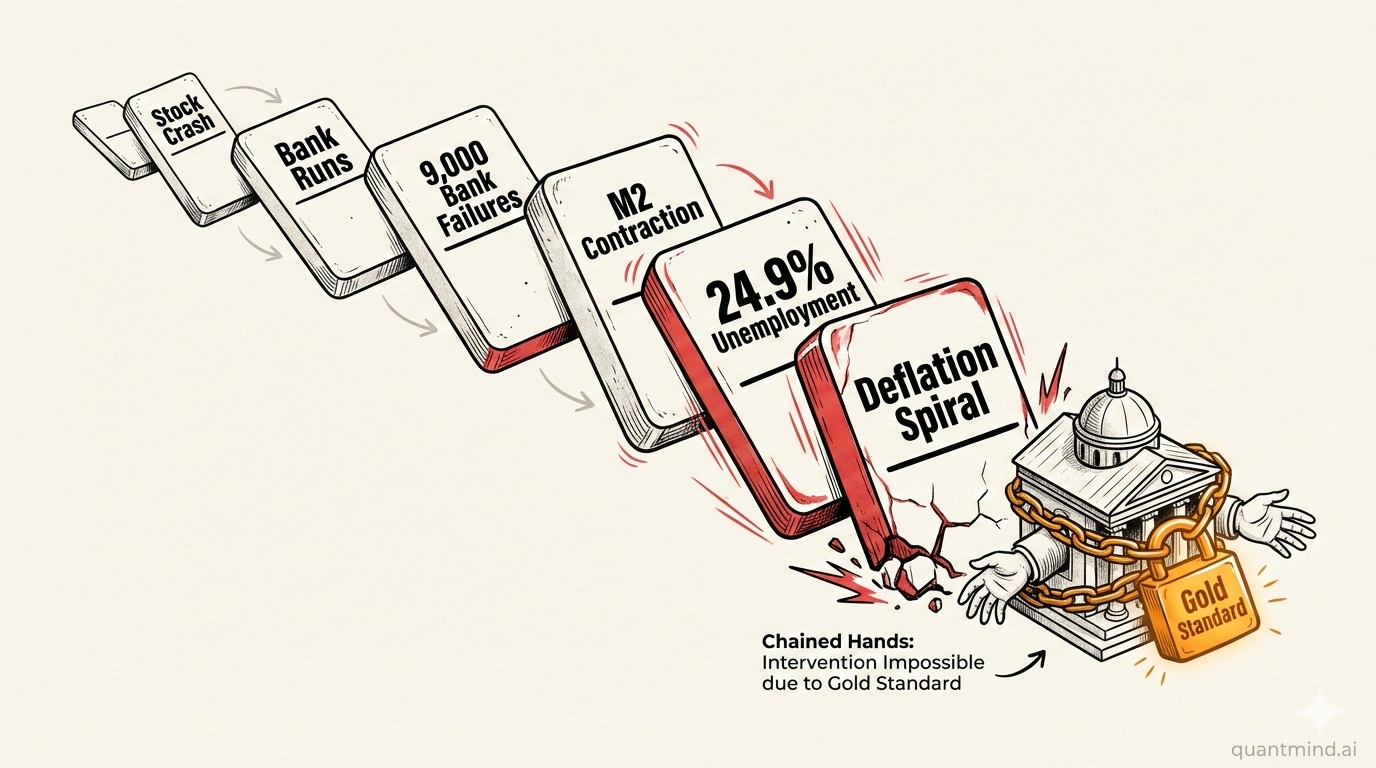
The stock crash itself was just the beginning. What turned a recession into the Great Depression was the collapse of the credit system.
Key data:
- Bank failures: Roughly 9,000 banks failed — one-third of every bank in the country. Depositors’ savings evaporated overnight. There was no deposit insurance.
- Bank runs: Depositors heard a neighboring bank had failed, rushed to withdraw from their own bank, causing healthy banks to fail from the run itself. Panic manufactured more panic.
- Money supply: M2 contracted severely. The credit multiplier ran in reverse. Banks wouldn’t lend, businesses couldn’t access capital, workers were laid off, consumption collapsed, corporate profits fell, bank bad debts increased — a death spiral.
- Unemployment: Surged from 3.2% to 24.9%. One in four Americans couldn’t find work.
- Prices: Severe deflation. Agricultural prices cratered. Farmers poured milk into rivers rather than sell at a loss — transportation costs exceeded the milk’s value.
What did the Hoover administration do?
They clung to the Gold Standard. Gold Standard meant the central bank could only issue currency backed by gold reserves. When the market desperately needed liquidity, the central bank’s hands were tied — couldn’t expand the balance sheet, couldn’t print money, couldn’t act as lender of last resort.
This is a textbook policy failure: choosing pro-cyclical tightening when counter-cyclical expansion was needed.
When Silicon Valley Bank collapsed in March 2023, the Fed launched BTFP (Bank Term Funding Program) within 48 hours, providing unlimited liquidity to all banks. Why the speed? Because they’d read the 1929 textbook. They understood that if they didn’t sever the panic transmission chain immediately, bank runs would spread like a virus.
1929 didn’t have that textbook. They were that textbook.
What Stays With Me
After rebuilding this data, three things sit with me:
First, leverage is a printing press in low volatility and a meat grinder in high volatility. Same tool, different volatility regimes, the distance between heaven and hell. In 1929 it was 10% margin. Today it’s 0DTE options, crypto’s high-multiple perpetual contracts, leveraged products embedded in ETFs. The instruments get more sophisticated, but leverage math never changes — your upside is linear, your risk is nonlinear.
Second, infrastructure is the lifeline of liquidity. In 1929 it was ticker tape bandwidth. Today? If a major exchange’s matching engine goes down for 30 seconds, or a DeFi protocol’s oracle feed lags, the effect could be as lethal as 1929’s 4-hour quote delay. We assume technological progress has eliminated this class of risk. In reality, it just migrated the risk to new bottlenecks.
Third, the regulatory arbitrage window is always finite. The 1920s had no securities law, no disclosure requirements, no margin limits, no deposit insurance. That regulatory vacuum birthed history’s largest bubble and its most devastating crash. In the aftermath, the Glass-Steagall Act (1933) and Securities Exchange Act (1934) fundamentally reshaped the American financial system.
Today’s crypto markets — no unified regulation, no mandatory disclosure, opaque leverage ratios, opaque stablecoin reserves — bear a resemblance to 1920s Wall Street that’s hard to ignore. AI-driven trading strategies grow increasingly complex while the regulatory framework remains a generation behind.
History doesn’t repeat in detail. But every bubble follows the same recipe: new technology + new narrative + easy credit + regulatory vacuum + the one variable in human nature that never updates.
The greed that wiped out margin accounts in 1929 and the greed that sends people all-in on high-leverage perpetuals today are the same greed.